Generating Practitioner Report
Overview
- Steps to view report using list view
- Information in the Practitioners Report
- Once you reviewed/edited your report, you can also download it
Steps to View Report
Open the project for which the discovery process was completed earlier. There are multiple ways to view the Practitioner Report.
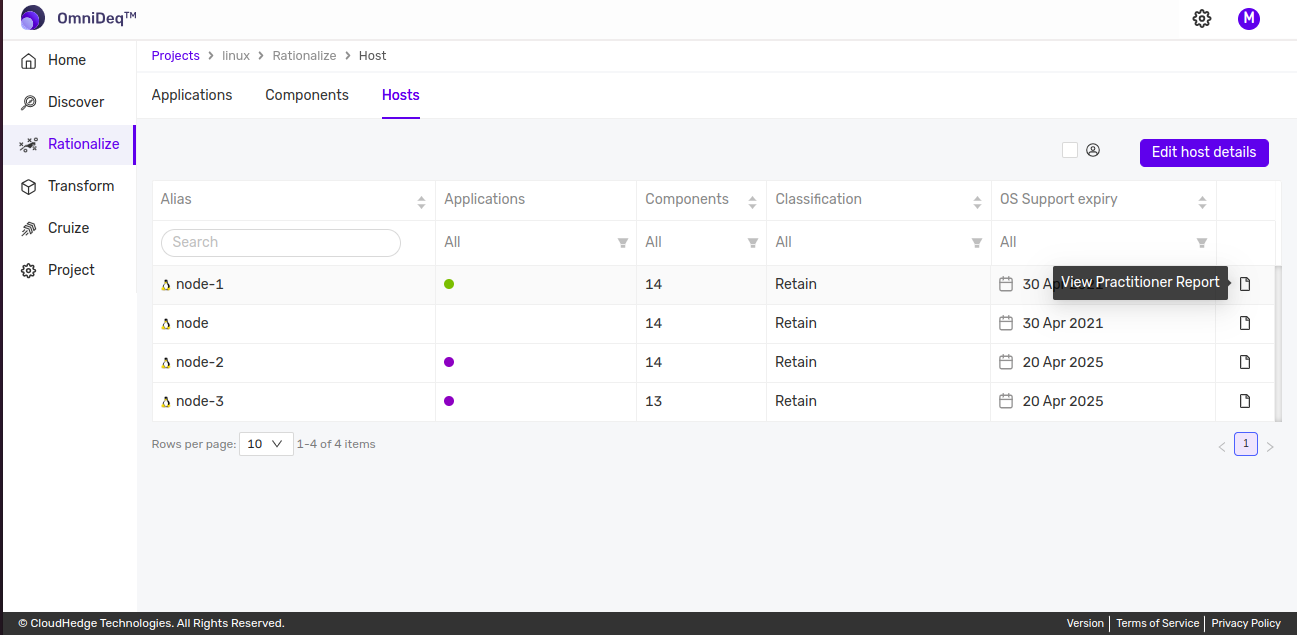
Option 1: From Rationalize - Hosts Tab
Click Rationalize. In the Rationalize view, click the Hosts tab and click View Practitioner Report as shown in the image below:
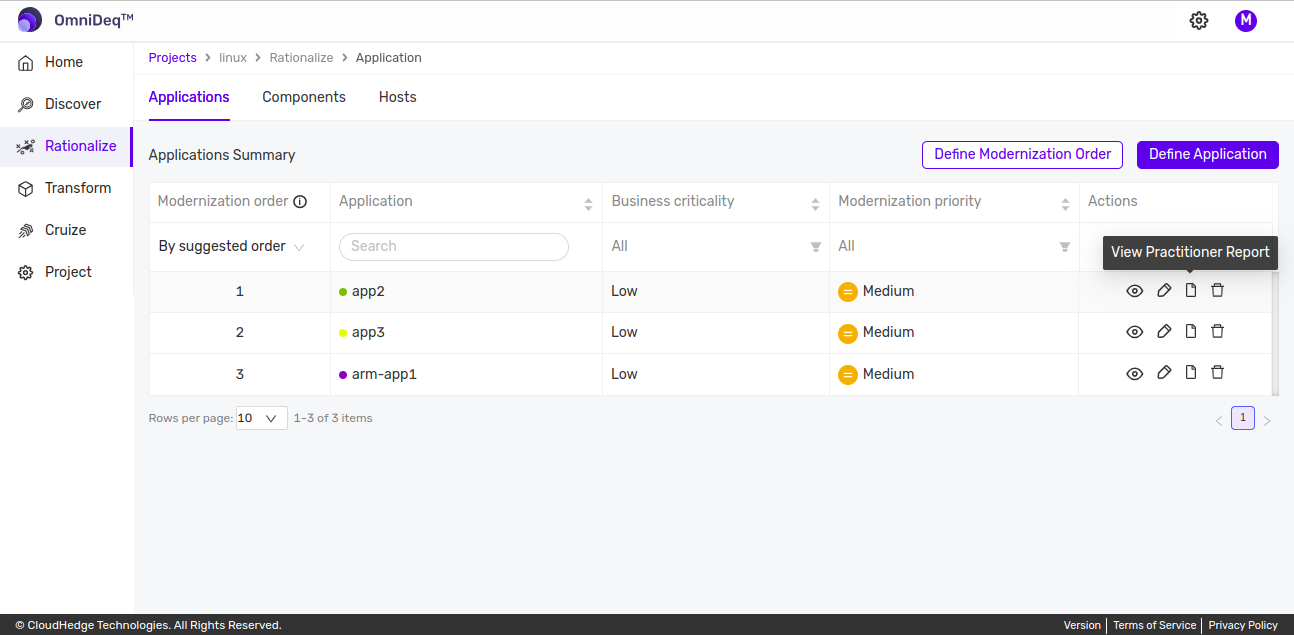
Option 2: From Rationalize - Applications
Click Rationalize. In the Rationalize view, if applications have been defined, you will see the defined applications. You can view the Practitioner Report for the application by clicking View Practitioner Report as shown in the image below:
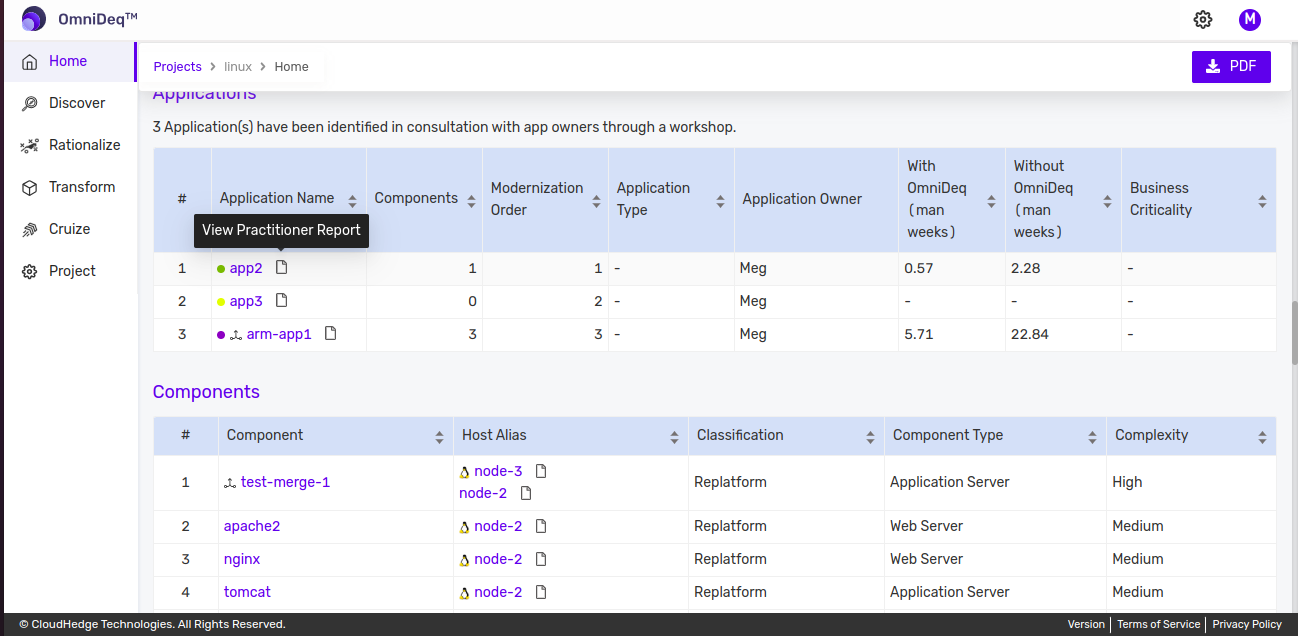
Option 3: From Project Landing Page - Applications Section
In the project landing page, scroll down to the Applications section. If any applications have been defined, they will be listed there. Click View Practitioner Report as shown in the image below:
Option 4: From Project Landing Page - Components Section
In the project landing page, scroll down to the Components section. In the Host Alias column of the table, the hosts are displayed. To view the Host Practitioner Report, click View Practitioner Report as shown in the image below:

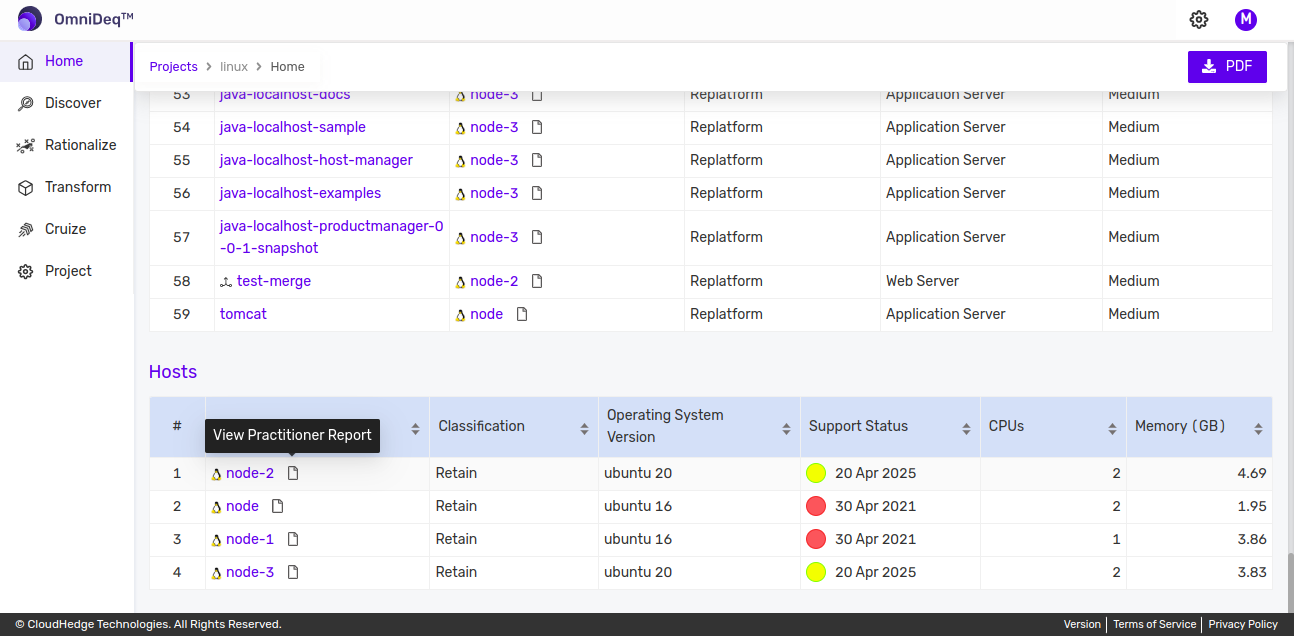
Option 5: From Project Landing Page - Hosts Section
In the project landing page, scroll down to the Hosts section. In the Host Alias column of the table, the hosts are displayed. To view the Host Practitioner Report, click View Practitioner Report as shown in the image below:
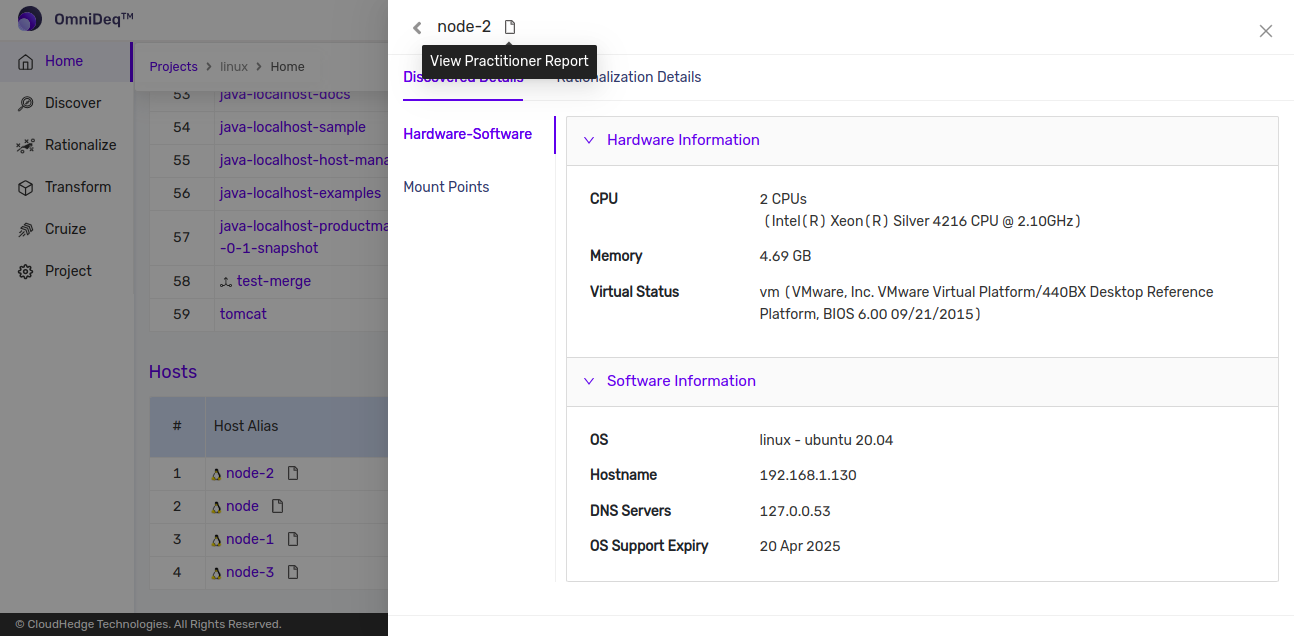
Option 6: From Project Landing Page - Hosts Details
In the project landing page, scroll down to the Hosts section. In the Host Alias column of the table, click on any host displayed. In the window that opens up, click View Practitioner Report as shown in the image below:
Practitioner Report Views
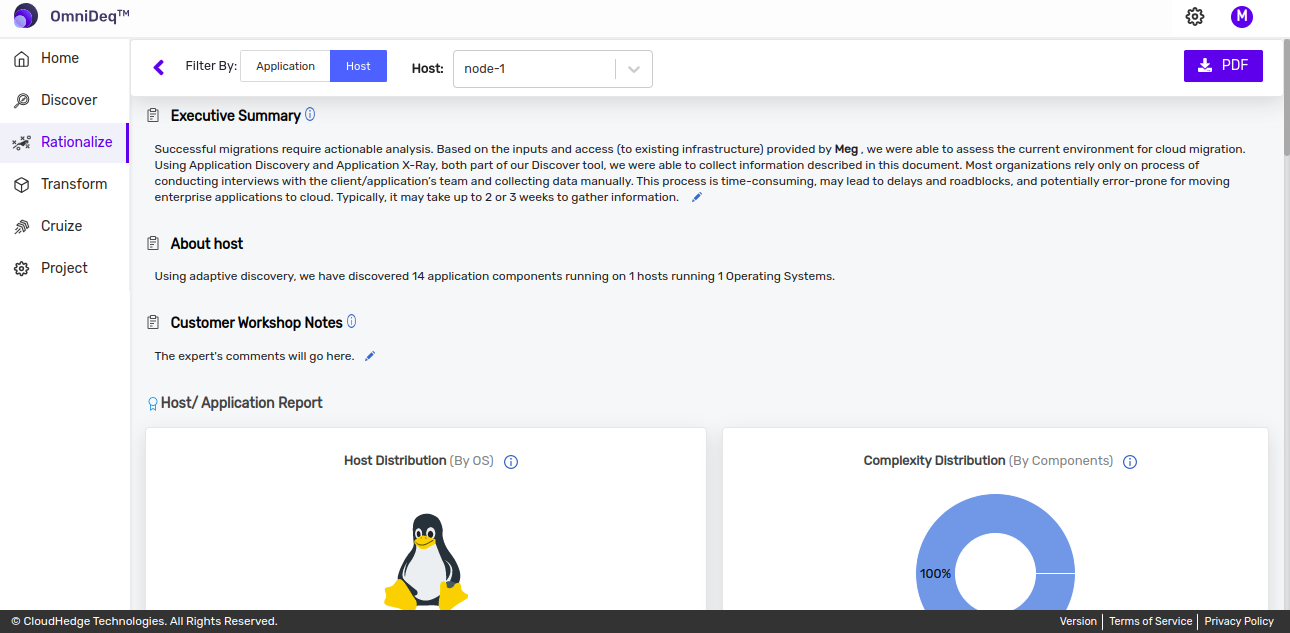
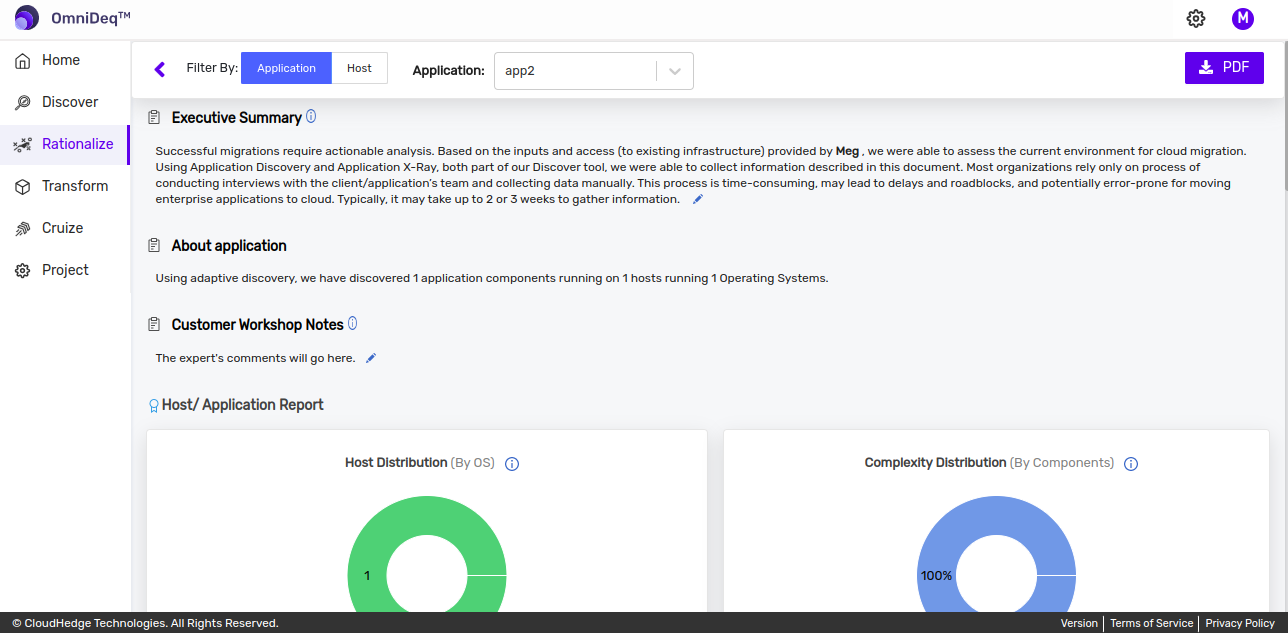
Clicking View Practitioner Report will open the Practitioner Report as shown below:
Host Practitioner Report:
Application Practitioner Report:
Edit Executive Summary and Customer Workshop Notes
You can edit the details of the 'Executive Summary' and 'Customer Workshop Notes' by modifying the existing information and changing the font styles of the text.
To edit the information, click on the description box. The editor will open as shown in the image below:
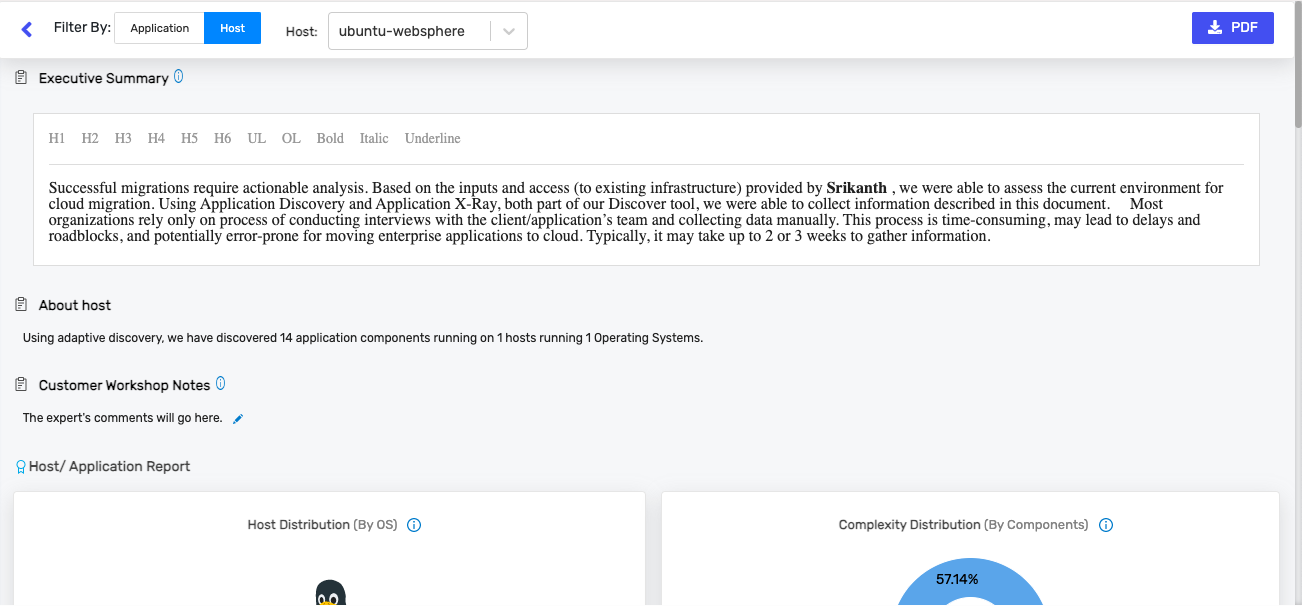
Information is saved once you click the Save button.
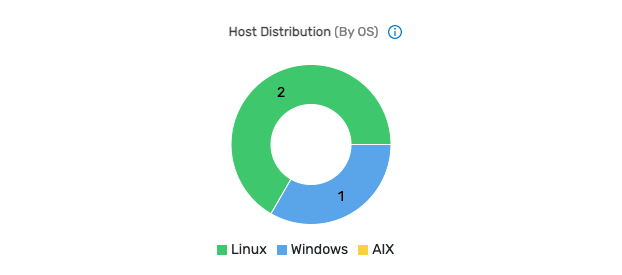
Host Distribution
This graph represents the distribution of hosts by OS, i.e., total number of Linux and Windows hosts present in the project.
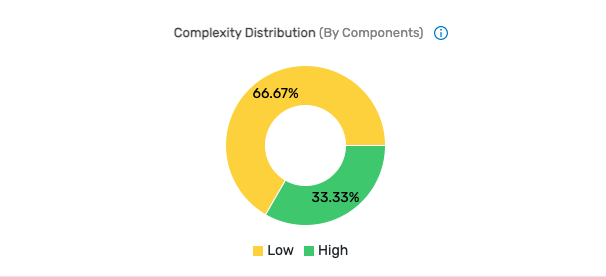
Complexity Distribution
- Complexity is a metric used to measure the effort required to transform an application
- Complexity distribution is an aggregated view of all the applications inside a selected project with their calculated complexity. This information can be used to determine how easy or difficult it is to transform certain processes in each application. Such information is crucial in giving estimates
How Complexity is Calculated
Every process in an application is passed through a set of criteria. Based on analysis of the discovered information in each criterion, modernization effort complexity, recommendation, and effort level are calculated.
Criteria Used in Linux X-Ray Completed Processes Complexity Calculations
| Complexity Criteria | Criteria Information |
|---|---|
| Is the 32-bit process or library detected? | 32-bit process or library has dependencies to run in a 64-bit container |
| Any network dependency hard coded? | If any external endpoint (IP address) the process connects to is not detected in any config file, it is concluded that it is hard-coded in the code. This needs the code change for the container to work. Instead of IP address, if it is FQDN then it can be managed via Kubernetes cluster config |
| Are additional packages required? | Most Kubernetes platforms recommend running the container as a non-root user. If the process is started as root, application changes may be required to run it as non-root in a container environment |
| What is the process user? | Most Kubernetes platforms recommend running the container as a non-root user. If the process is started as root, application changes may be required to run it as non-root in a container environment |
| Is any special file permission detected? | Special file permissions like sticky bit need special handling in a container environment |
| Any special files detected? | Applications like "Jenkins" create a startup file in the user's home directory which it refers to while every restart. This is not part of application binaries or configs and needs specific handling |
| Any hard coding is detected in /etc/hosts? | If any IP-FQDN mapping from /etc/hosts is used as an outgoing network connection, it requires to be supplied to container at runtime via cluster config |
| Any external DNS servers detected? | If the process queries the DNS server for FQDN resolution, then all the relevant entries it queried are required to be accessible from containers via the cluster config |
| Any external services consumed? | All the external network connections are required to be accessible from containers via the cluster config |
| Any file system writes detected? | If the process writes to a file, in order to make the data persistent the file write should be made persistent volume in the cluster environment |
| Effort Complexity without CHAI™ Transform | The overall containerization effort complexity is calculated as the weighted average of the above 10 criteria plus the base container complexity. The base complexity includes choosing the appropriate base container, adding process files and dependencies, setting env variables, exposing ports, adding user and startup command |
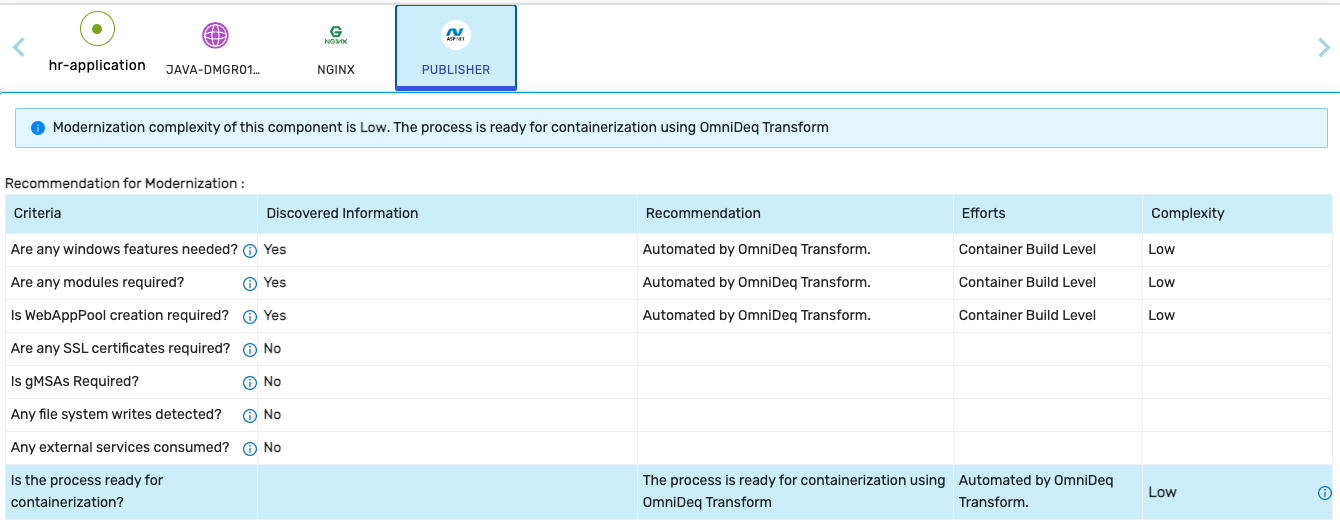
Criteria Used in Windows Websites Complexity Calculations
| Complexity Criteria | Criteria Information |
|---|---|
| Are any Windows features needed? | Add .NET Framework and ASP.NET features to the container for ASP.NET application to run |
| Are any modules required? | Any other administration modules required to run and manage the container |
| Is WebAppPool creation required? | ASP.NET application runs inside the WebApp Pool |
| Are any SSL certificates required? | Is the web application accessible over secure channel? |
| Is gMSAs required? | Does the ASP.NET application depend on Windows Active Directory authentication? |
| Any file system writes detected? | If the process writes to a file, in order to make the data persistent the file write should be made persistent volume in the cluster environment |
| Any external services consumed? | All the external network connections are required to be accessible from containers via the cluster config |
| Effort Complexity without CHAI™ Transform | The overall containerization effort complexity is calculated as the weighted average of the above 7 criteria |
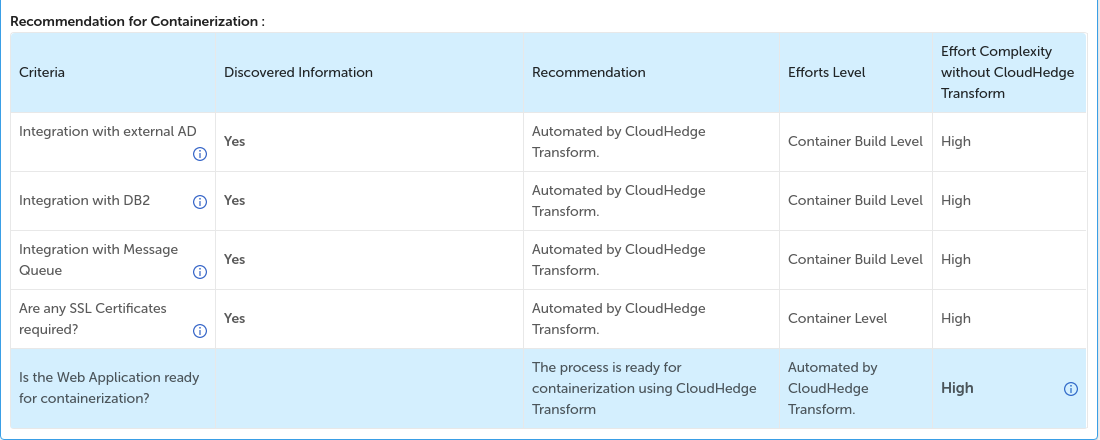
Criteria Used in Processes Ready to Transform Without X-Ray (WebSphere Server) Complexity Calculations
| Complexity Criteria | Criteria Information |
|---|---|
| Integration with external AD | Is the web application getting authenticated against Active Directory? |
| Integration with DB2 | Is the web application connecting to IBM DB2? |
| Integration with Message Queue | Is the web application connecting to any messaging queue (for example IBM Queue, Active MQ)? |
| Are any SSL Certificates required? | Is the web application secured with SSL Certificate? |
| Effort Complexity without CHAI™ Transform | The overall containerization effort complexity is calculated as the weighted average of the above 4 criteria |
Complexity Score Categories
The overall containerization effort complexity is calculated as the weighted average of the applicable criteria per process and is used to categorize the application complexity into Low, Medium, and High.
| Score | Complexity |
|---|---|
| 0 - 25 | Low |
| 26 - 35 | Medium |
| 36 and above | High |
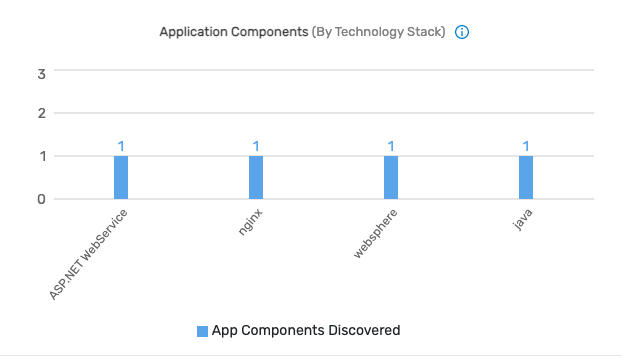
Application Components By Technology Stack
- Technology stack is the underlying technology upon which an application is running. For instance, an application like a website will have HTML, CSS, JavaScript, and Nginx as their technology stack
- This section displays an aggregated count of application components and their technology stack identified by the tool, which are running on the hosts
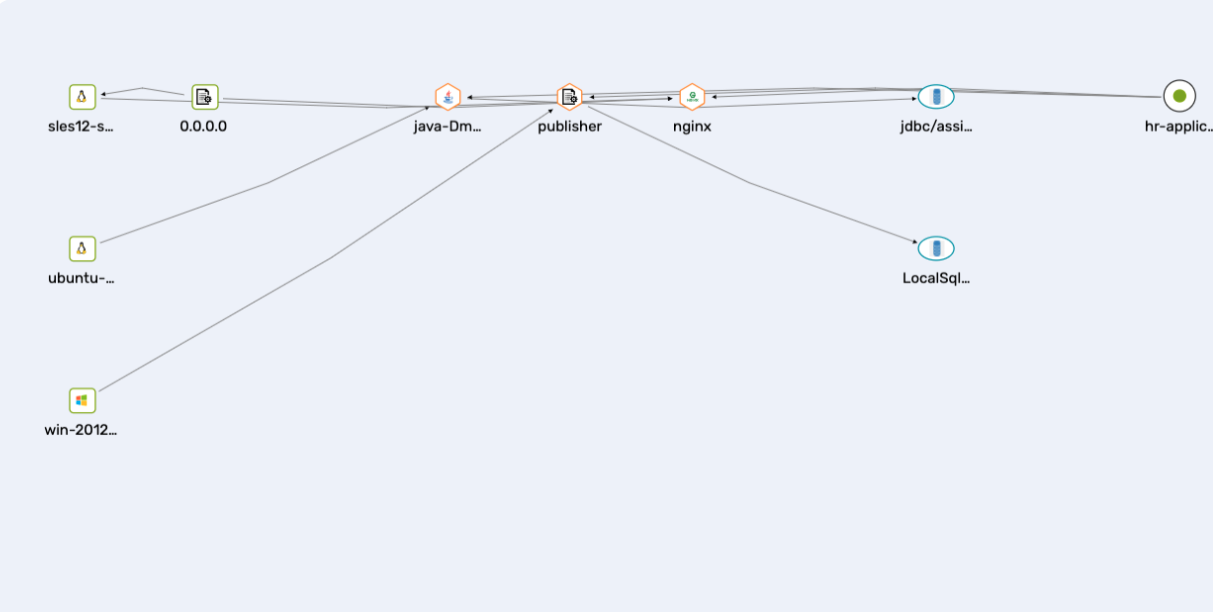
Topology
- Topology shows the connections between the nodes and their processes
- Please click here to learn more about topology
Application Information
Please click here to learn more about how to create applications.
Overall Migration Recommendation

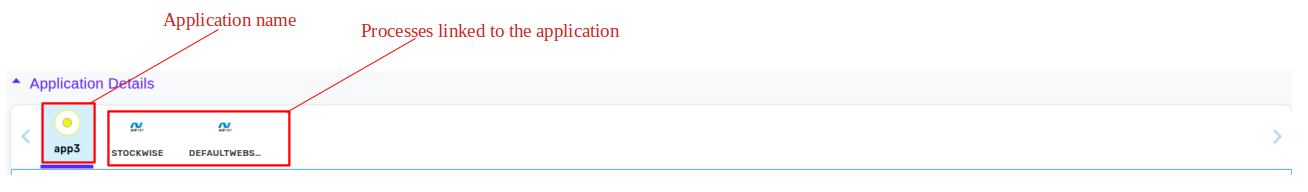
Application Components
Each application contains a set of processes. The scrollable process list is displayed as shown in the image below:
Individual Component Information
Every component under the selected application is clickable and individual process information such as attributes for modernization and criteria used for effort complexity calculation without CHAI™ Transform is available as shown in images below:
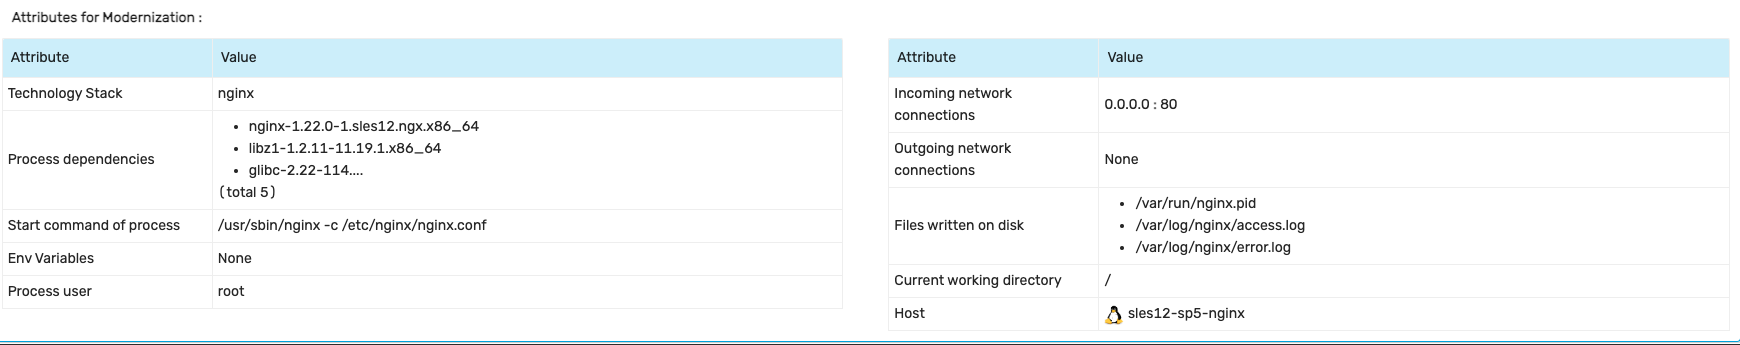
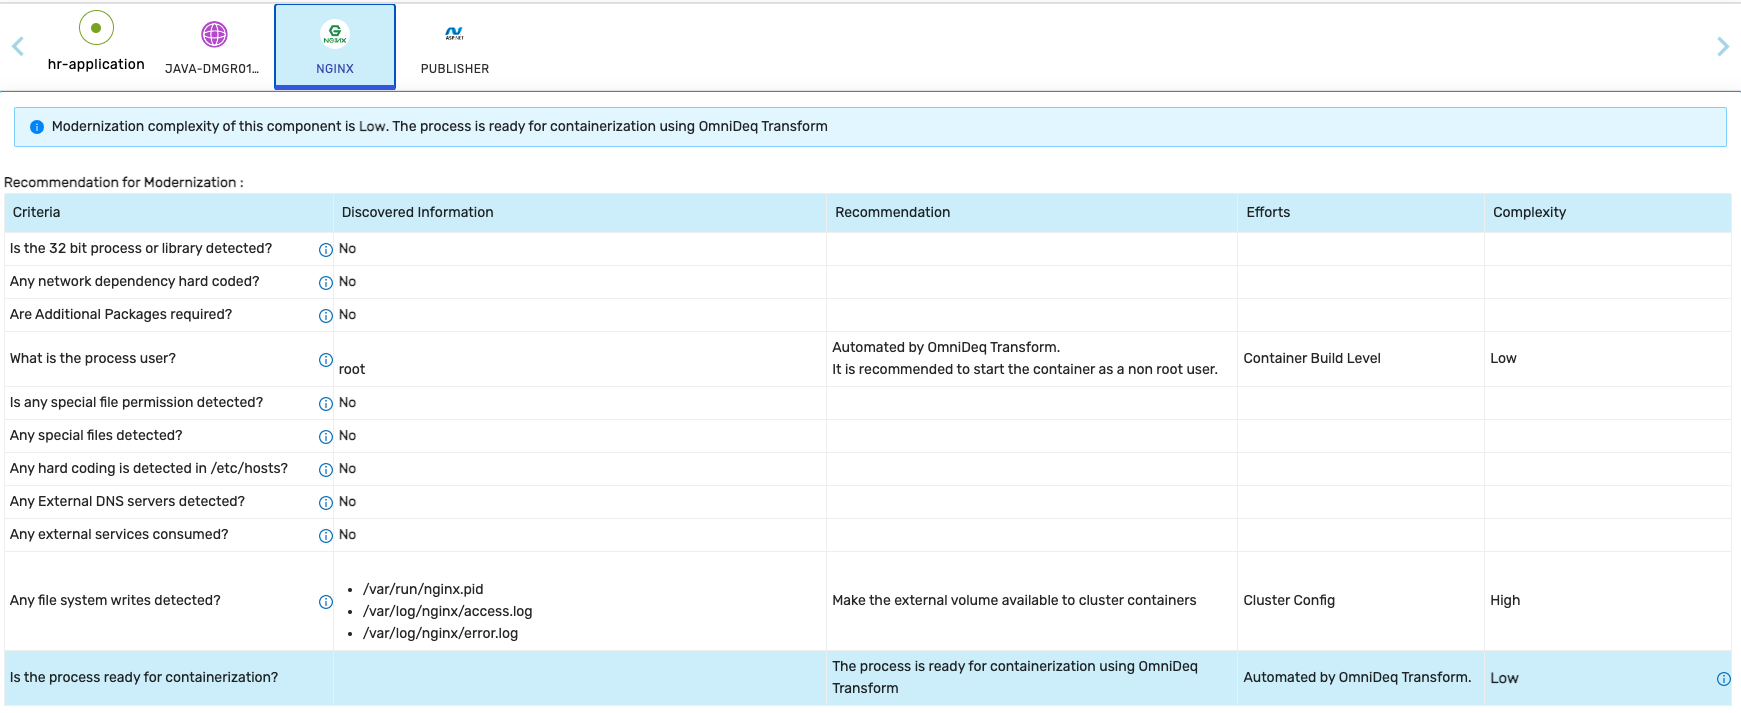
1. Linux Process
Attributes for Modernization:
Recommendation for Modernization Criteria:
Each criteria definition is available here.
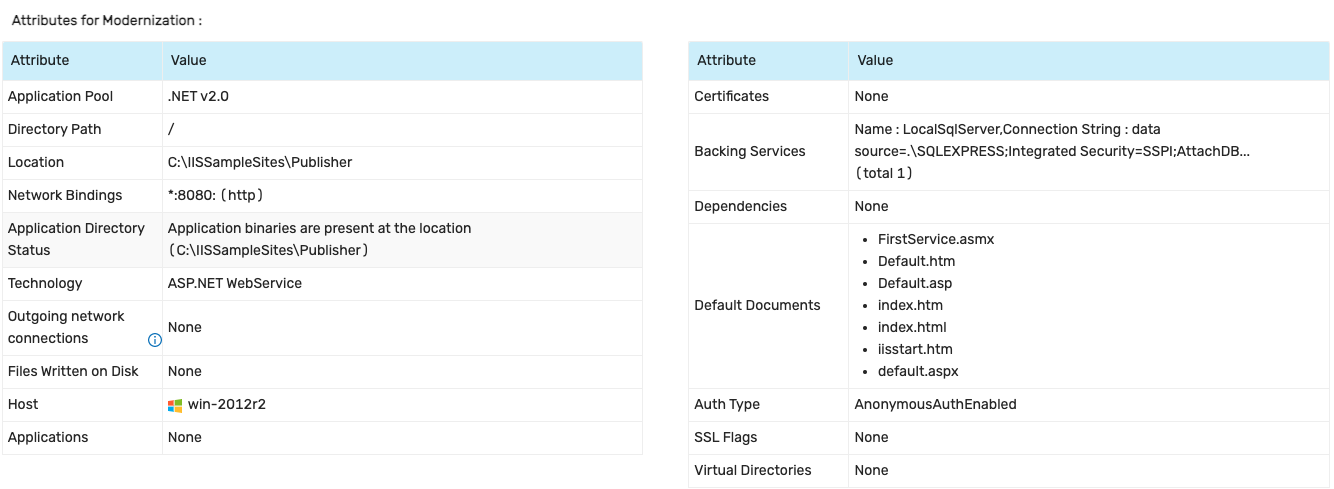
2. Windows Websites
Attributes for Modernization in case of IIS server:
Recommendation for Modernization Criteria in case of IIS server:
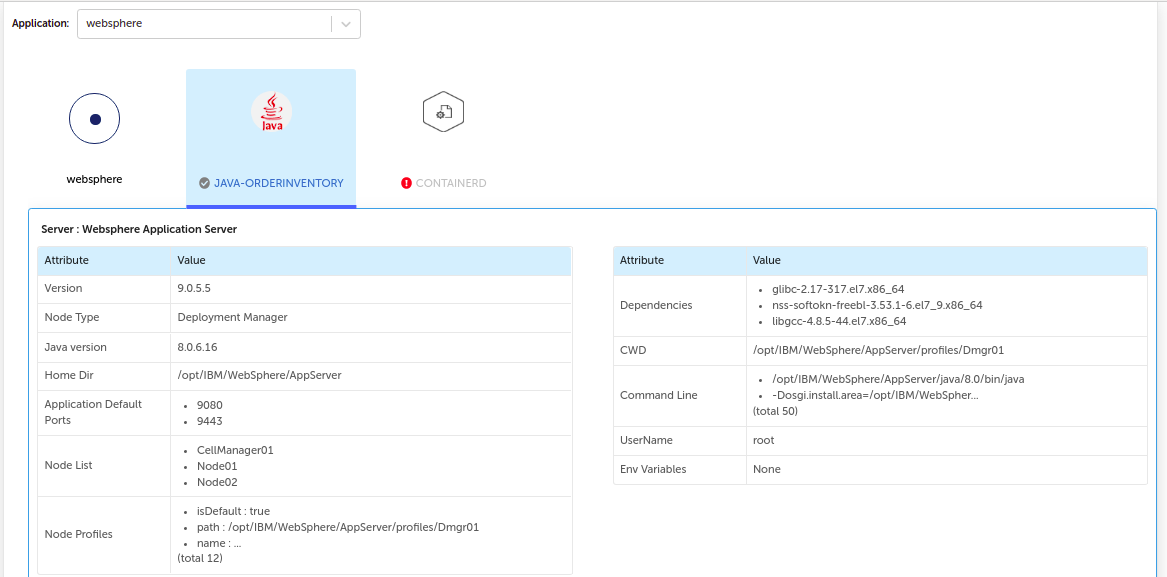
3. Linux WebSphere Application Server
WebSphere server information:
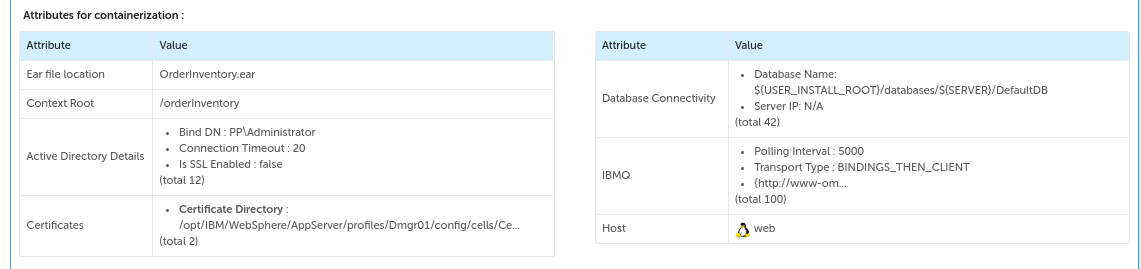
Attributes for containerization in case of WebSphere server:
Recommendation for Containerization Criteria in case of WebSphere server:
Host Information
If you are viewing an application's Practitioner Report, you can toggle to host view as shown in the image below:
Scroll down to view the host information, as shown in the image below:
Host information contains: Operating System, Discovered On, IP Address, CPU Cores, Memory, CPU Family in Host Information table, DNS Servers, Static Host Entries, and Storage Information for all hosts in separate tables.
You can also view information for a different host by selecting the host from the dropdown as shown in the image below:
Download Report
After all the edits are done and you have reviewed all the sections in the Practitioner Report, you can click the PDF button as shown in the image below:
It will open the report in the print window as shown in the image below:
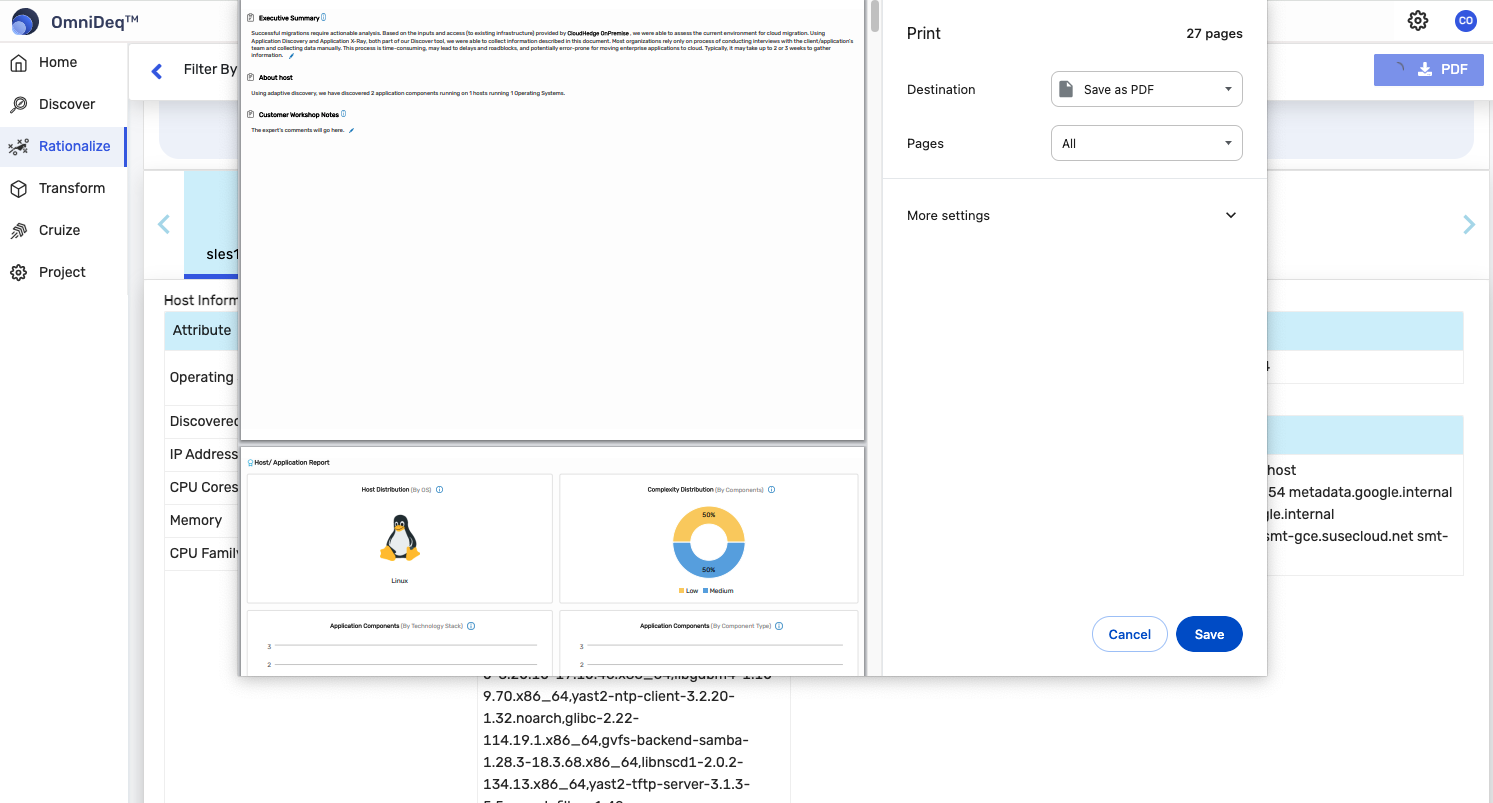
Click Save to download the PDF copy of the report.