DART Report
Overview
- Steps to view report
- Information in the DART Report
- Export DART report
Steps to View Report
Open the project for which the discovery process was completed earlier. The landing page is the DART report.
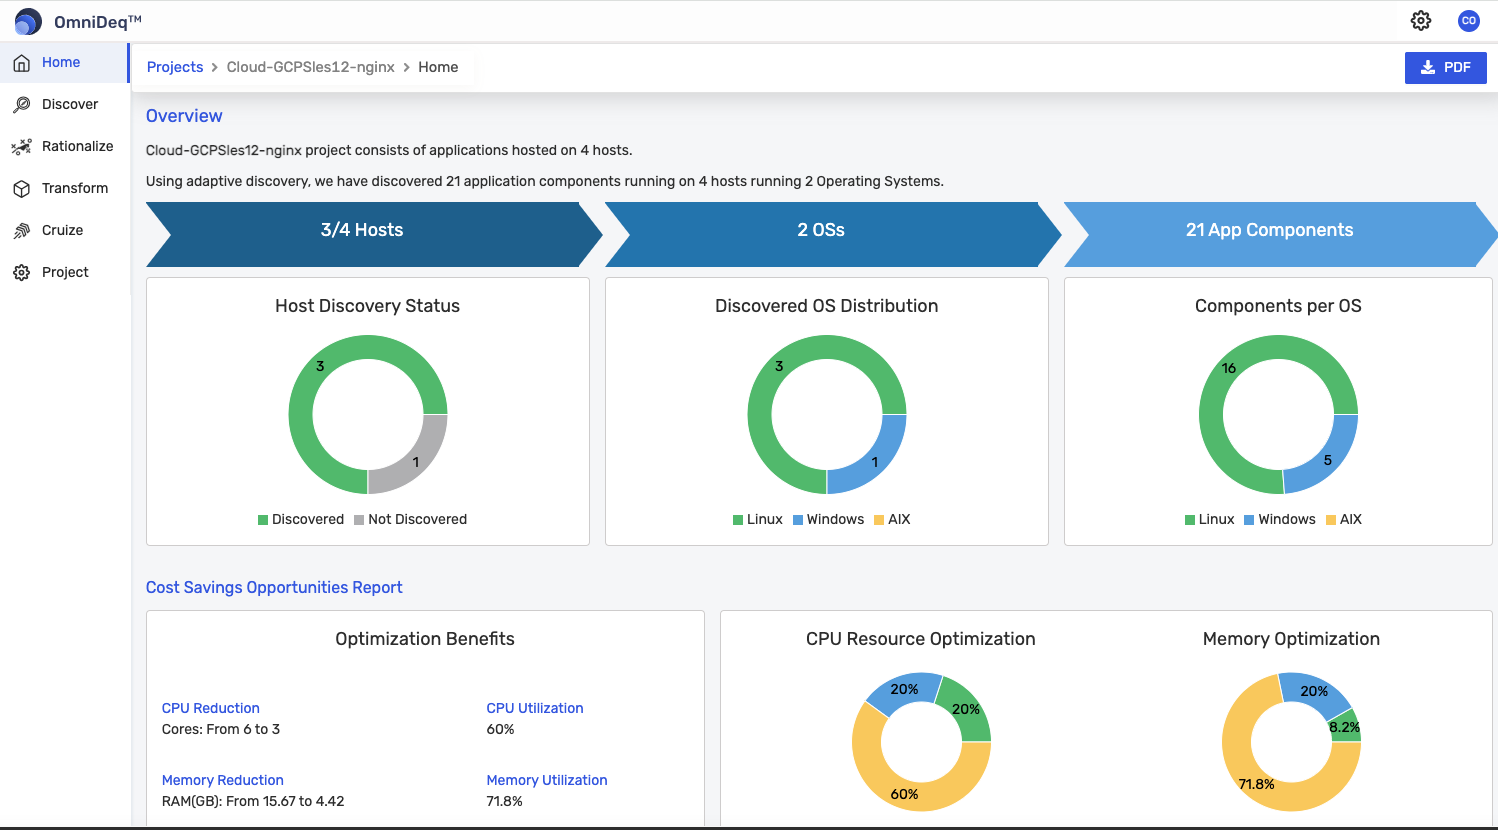
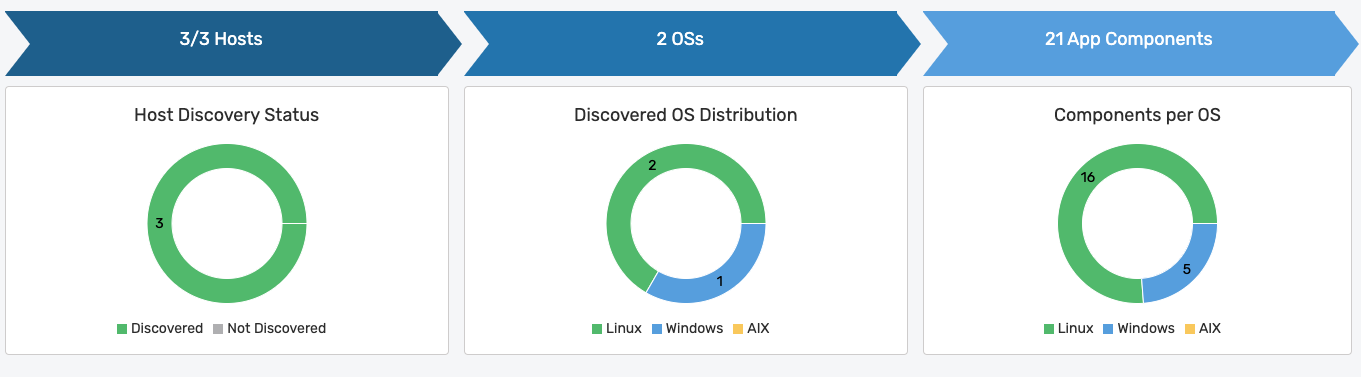
High Level Information
In this section, a high-level overview of the number of hosts discovered, the different types of operating systems, and the number of components detected are displayed, as shown in the image below:
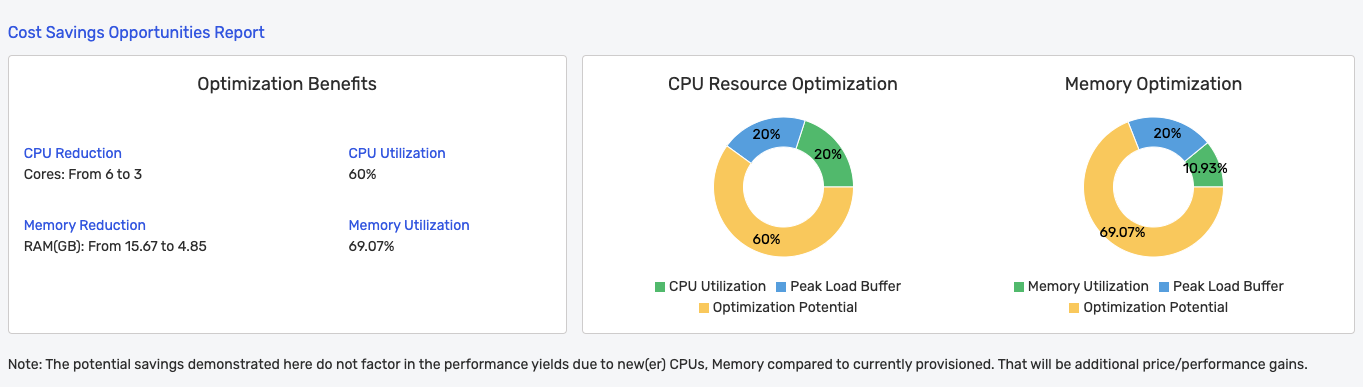
Cost Savings Opportunity
Based on the discovered information, cost savings are displayed as shown below:
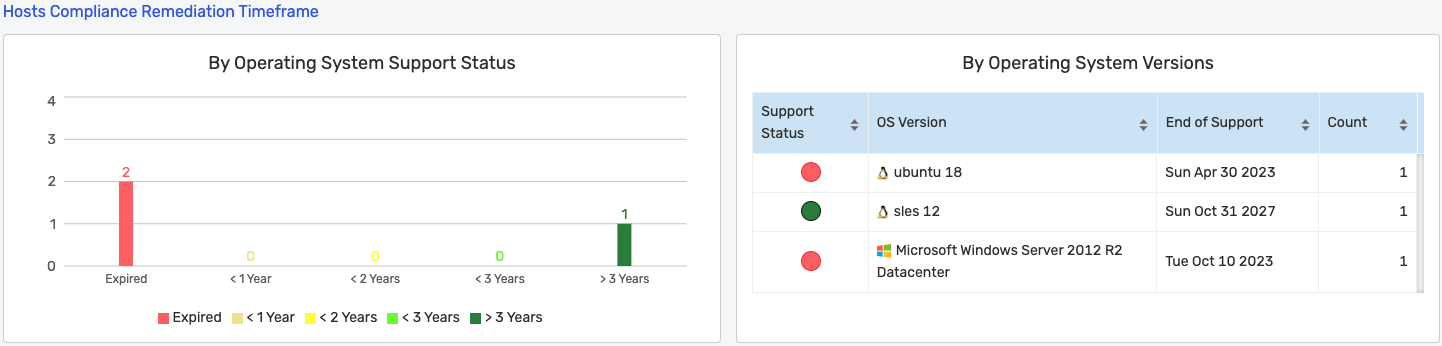
Host Compliance Remediation Timeframe
- This section represents host distributions by operating system license expiry
- This graph is useful for business stakeholders to prioritize based on license expiry dates. The hosts that have licenses expired should be taken up first for modernization of applications deployed on them
- License expiry is divided into 5 sections based on period: Expired, Less than a year, In 2 years, In 3 years, and More than 3 years
- The remaining duration of the license is determined from the date the report is generated
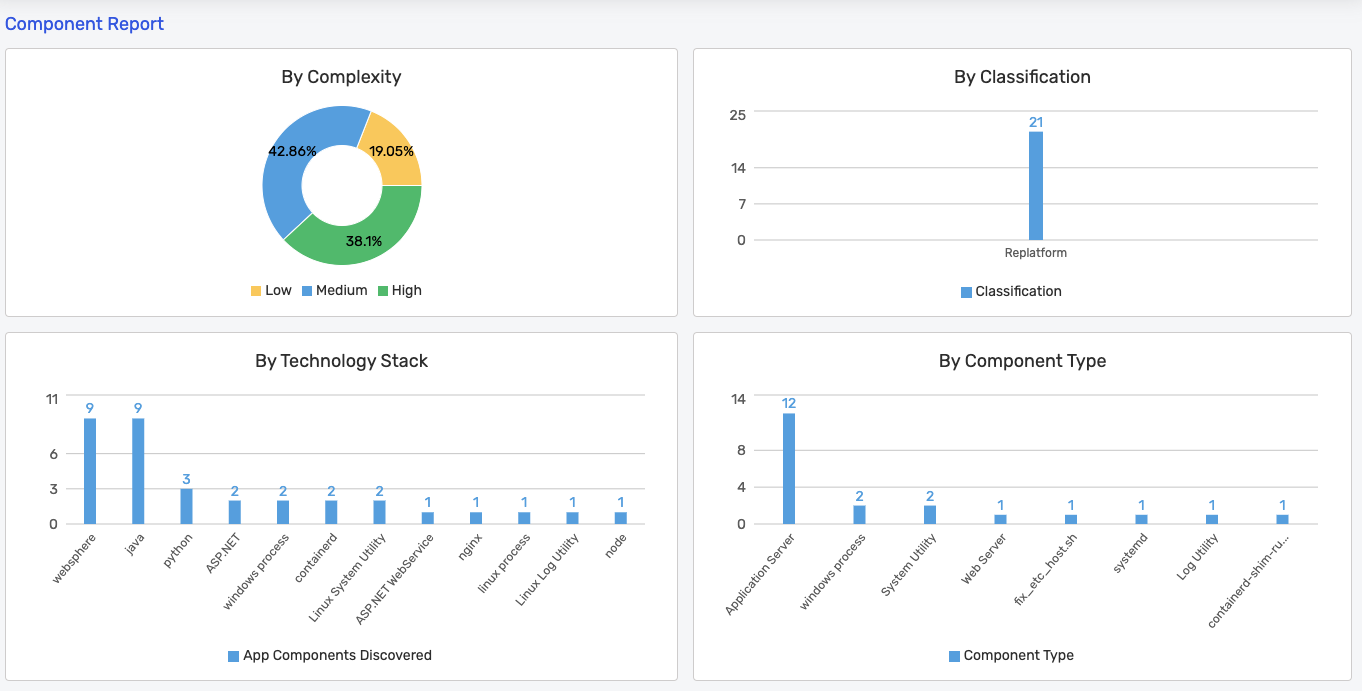
Component Report
- Complexity of modernizing the different components discovered
- Classification of the components discovered
- Distribution of the components discovered based on technology stack. Technology stack is the underlying technology upon which an application is running. For instance, an application like a website might have HTML, CSS, JavaScript, and Nginx as their technology stack
- Distribution of the components discovered based on component type. Component type examples are website, application server, database, etc.
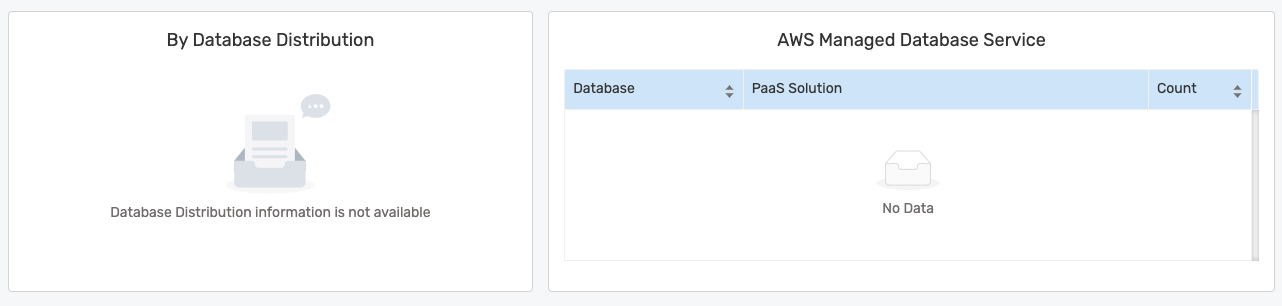
Database Distribution
Database applications found are displayed in this section.
If no databases are found, the following is displayed:
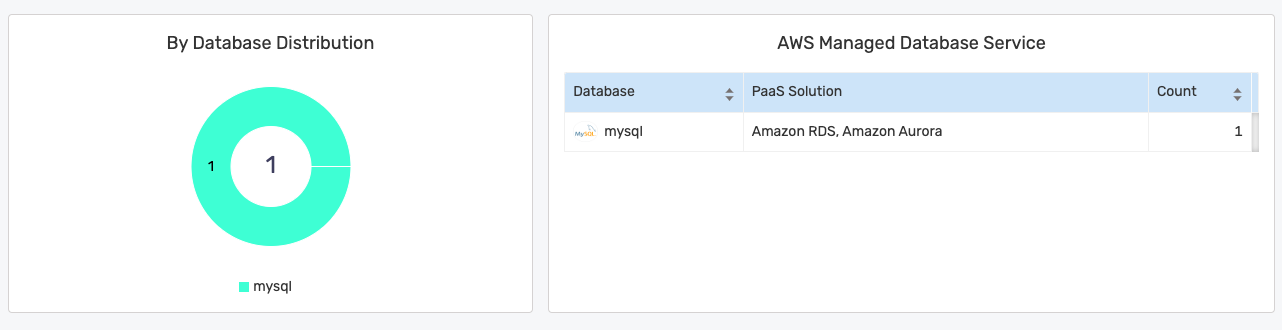
If databases are found, they are displayed as shown below. The managed database service shown depends on the project's target cloud setting:
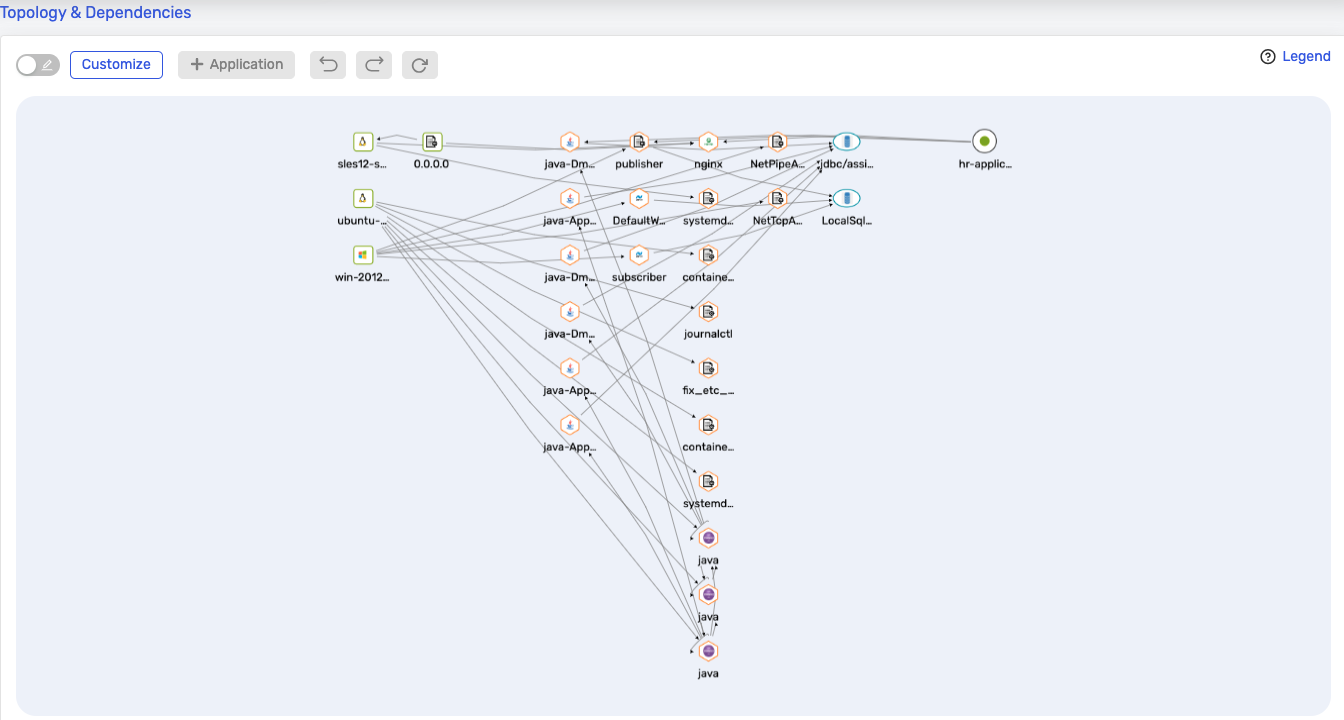
Topology
- Topology shows the connections between the nodes and their processes
- Please click here to learn more about topology
- By default, the topology is hidden. Please click the Generate button to display the topology

Application Information
Please click here to learn more about how to create applications.
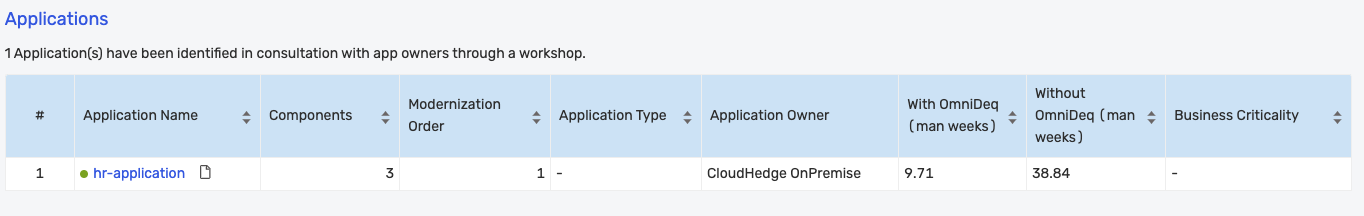
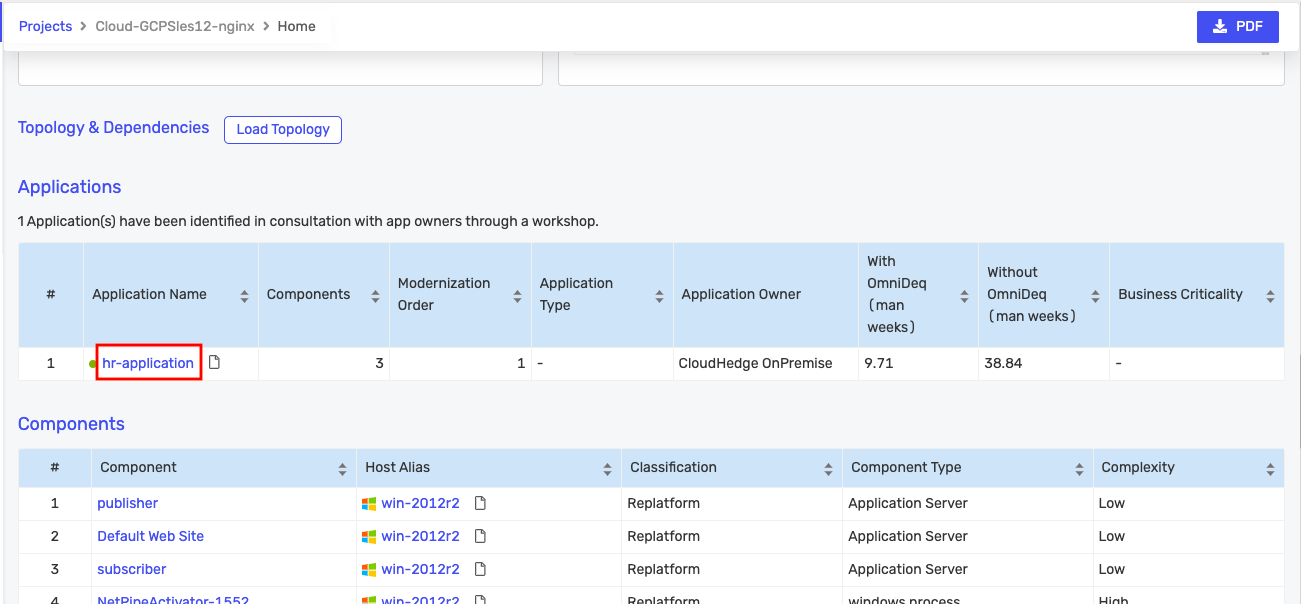
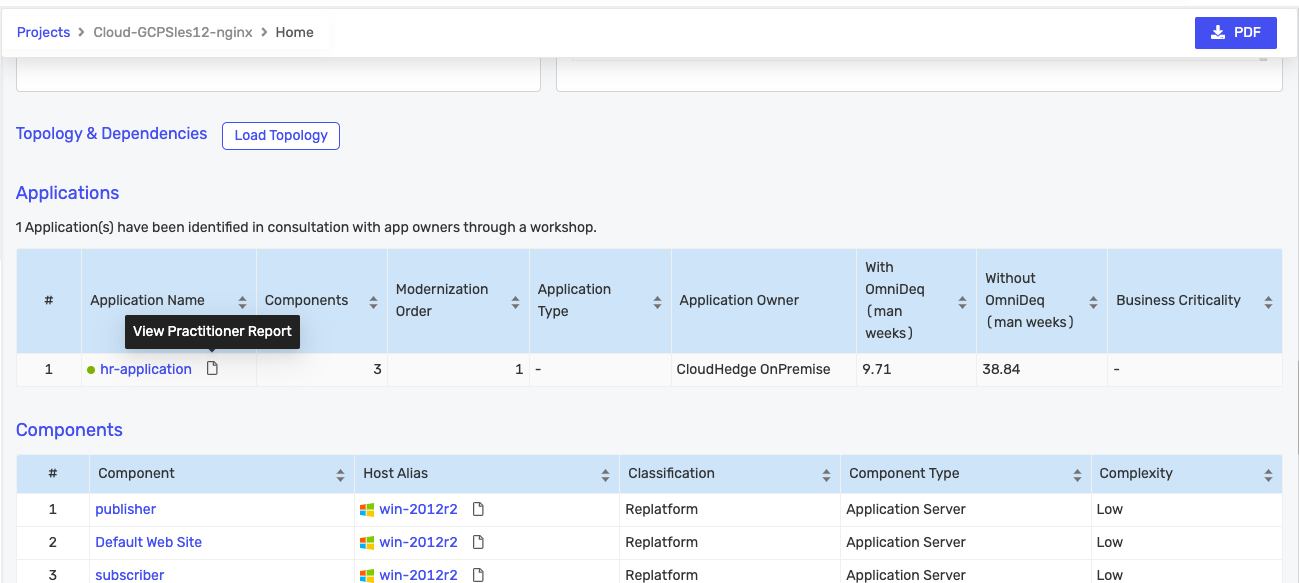
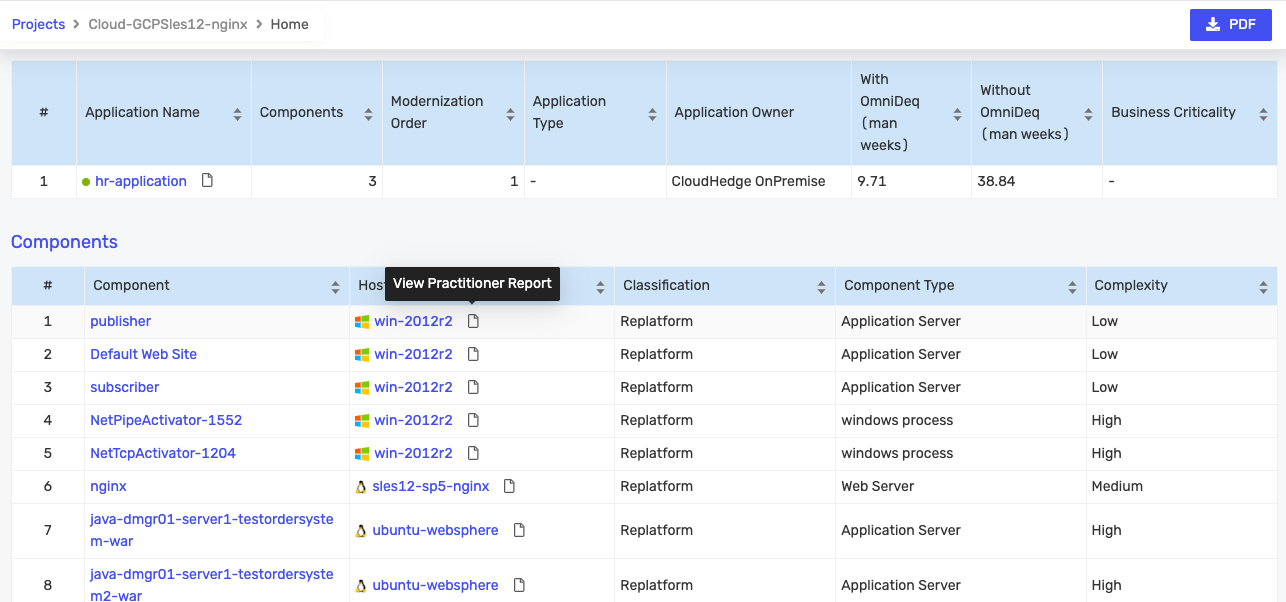
If applications have been defined, they will be listed as shown below:
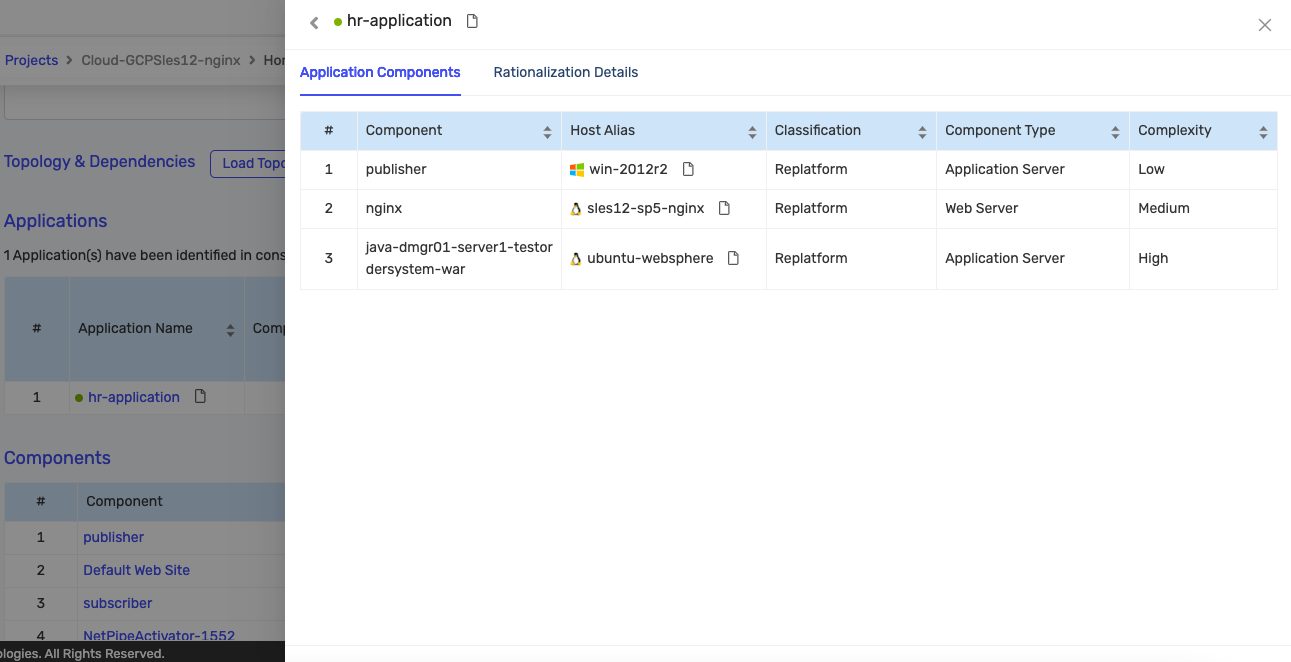
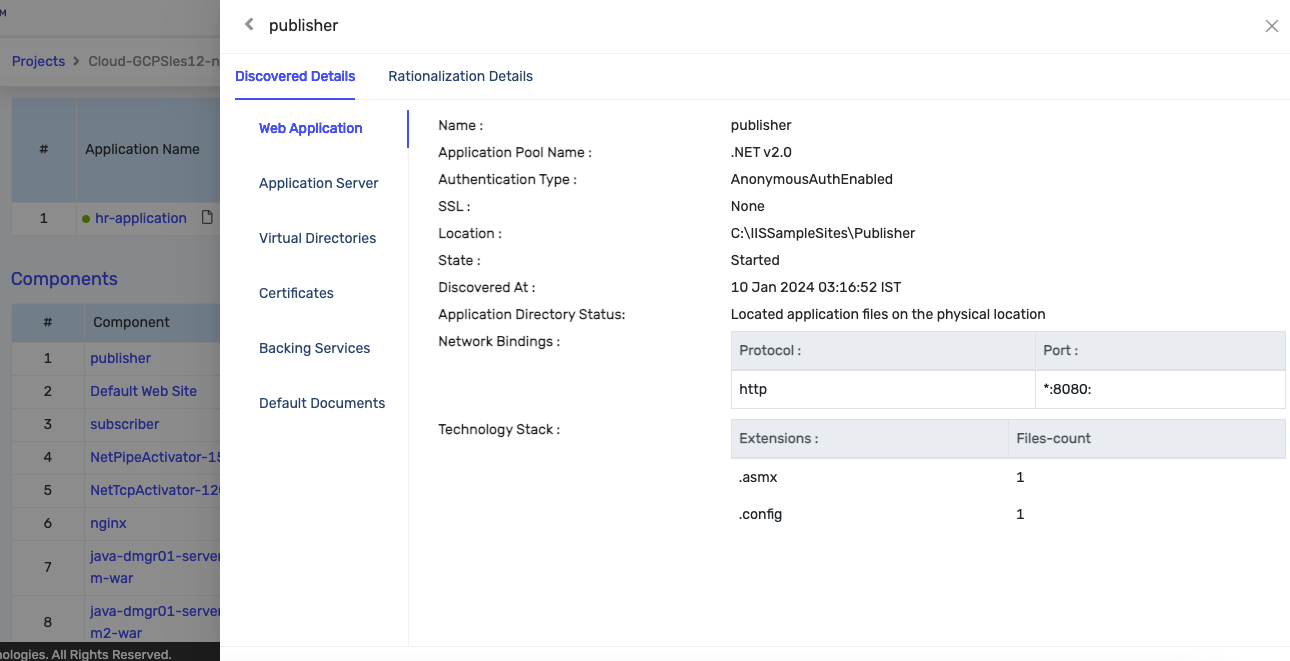
You can click on the eye icon of the application to get additional information about it:
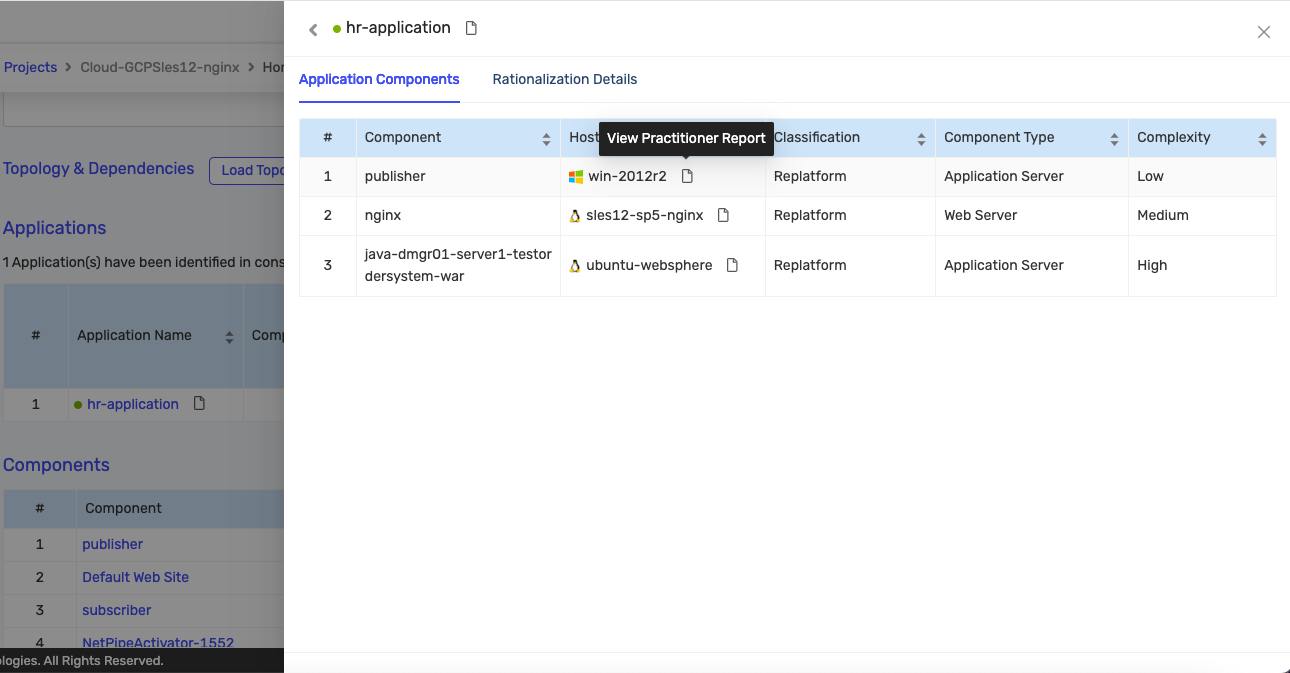
Clicking on it opens the following screen:
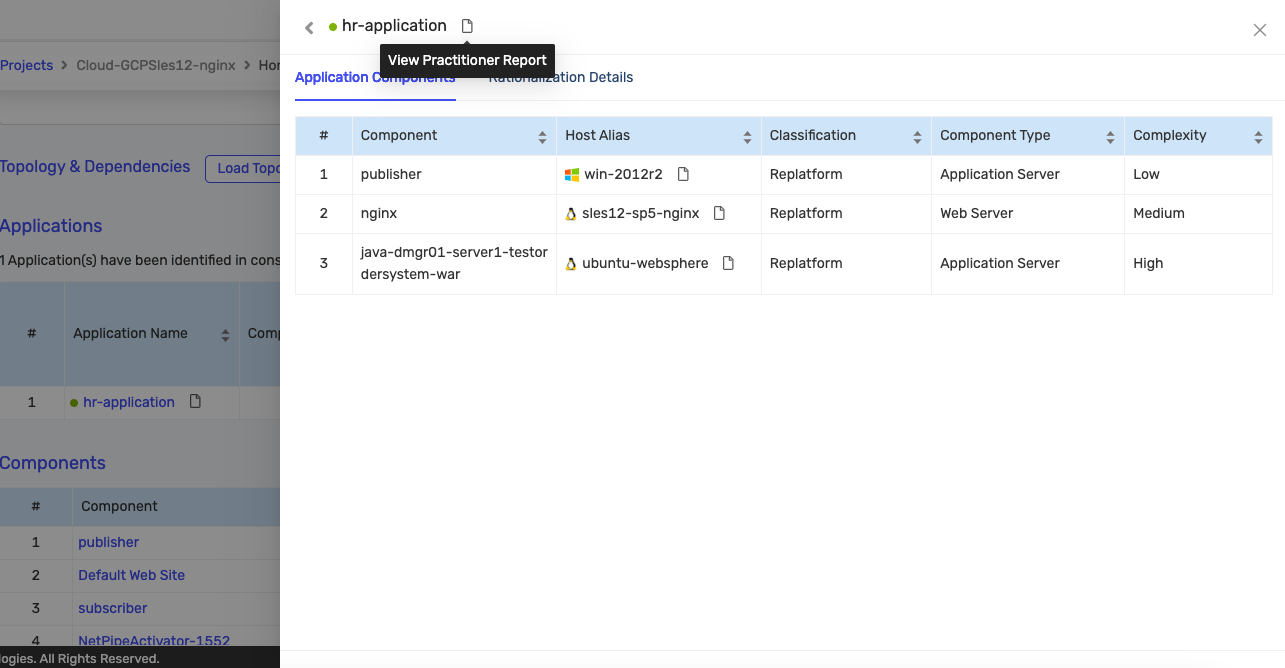
You can view the Practitioner Report for the application or any of the hosts from this page.
For Application:
For Host:
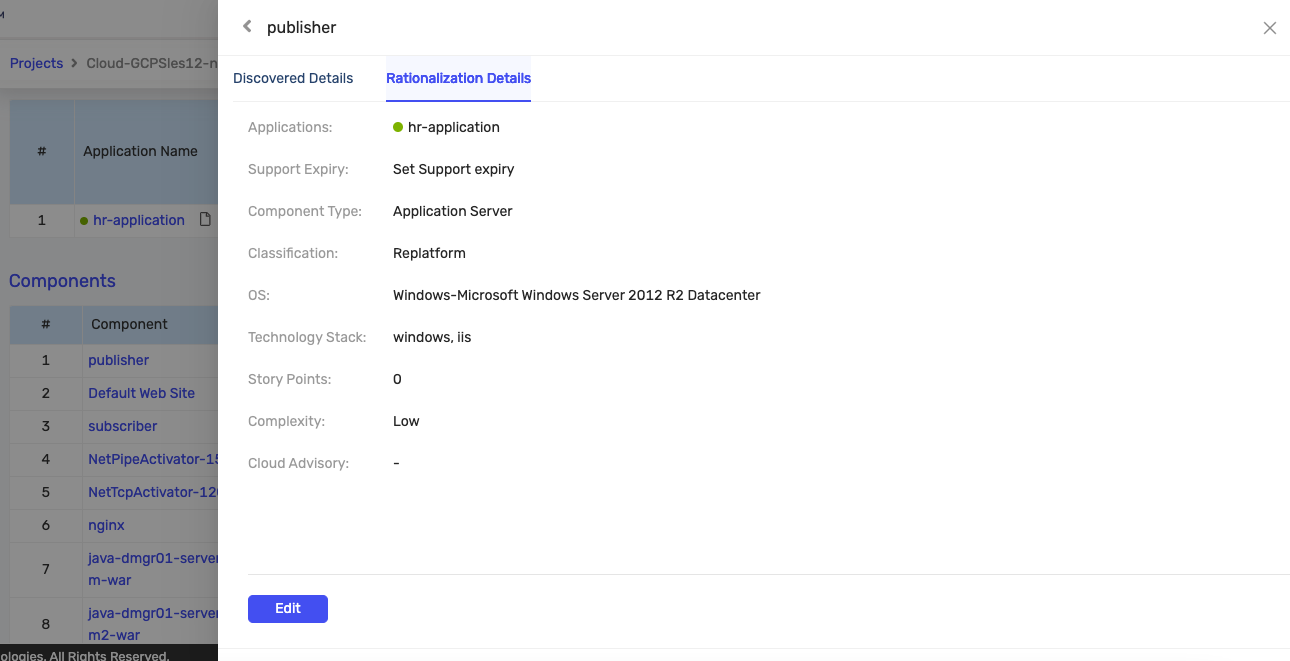
Click on the Rationalization Details tab to see details about the application:
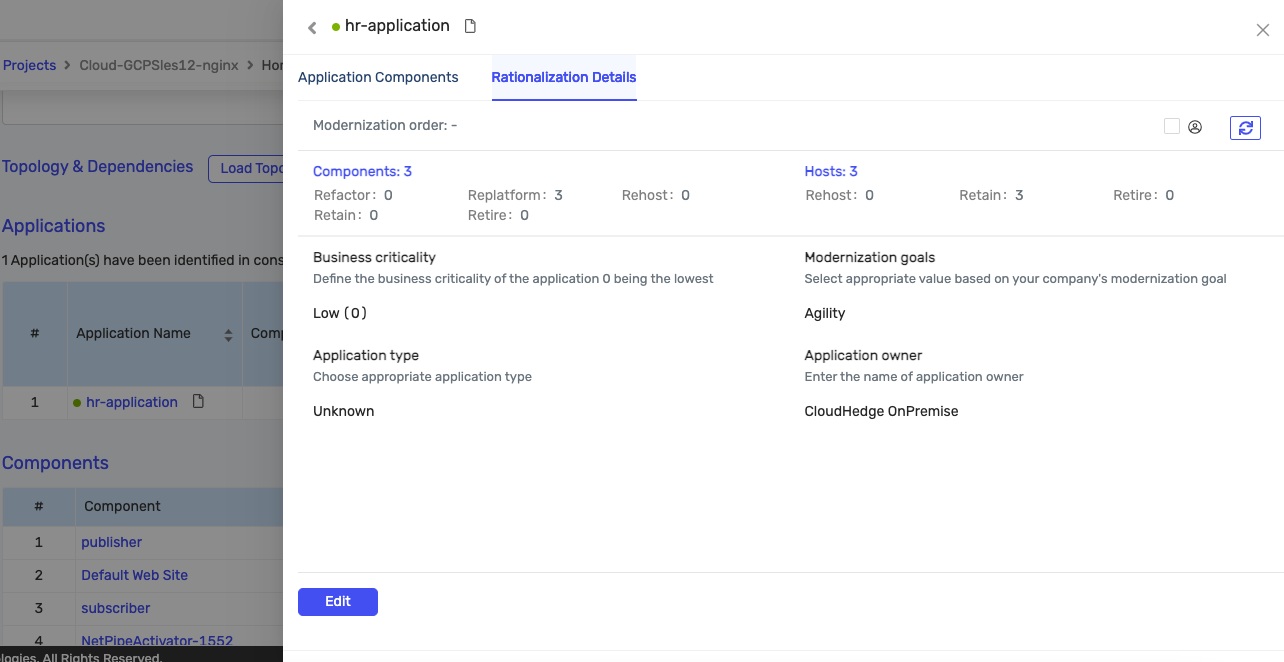
You can edit the details of the application by clicking the Edit button.
You can also view the Practitioner Report for the application from the DART report as shown below:
Components
A table of the components discovered with additional details is displayed as shown below:
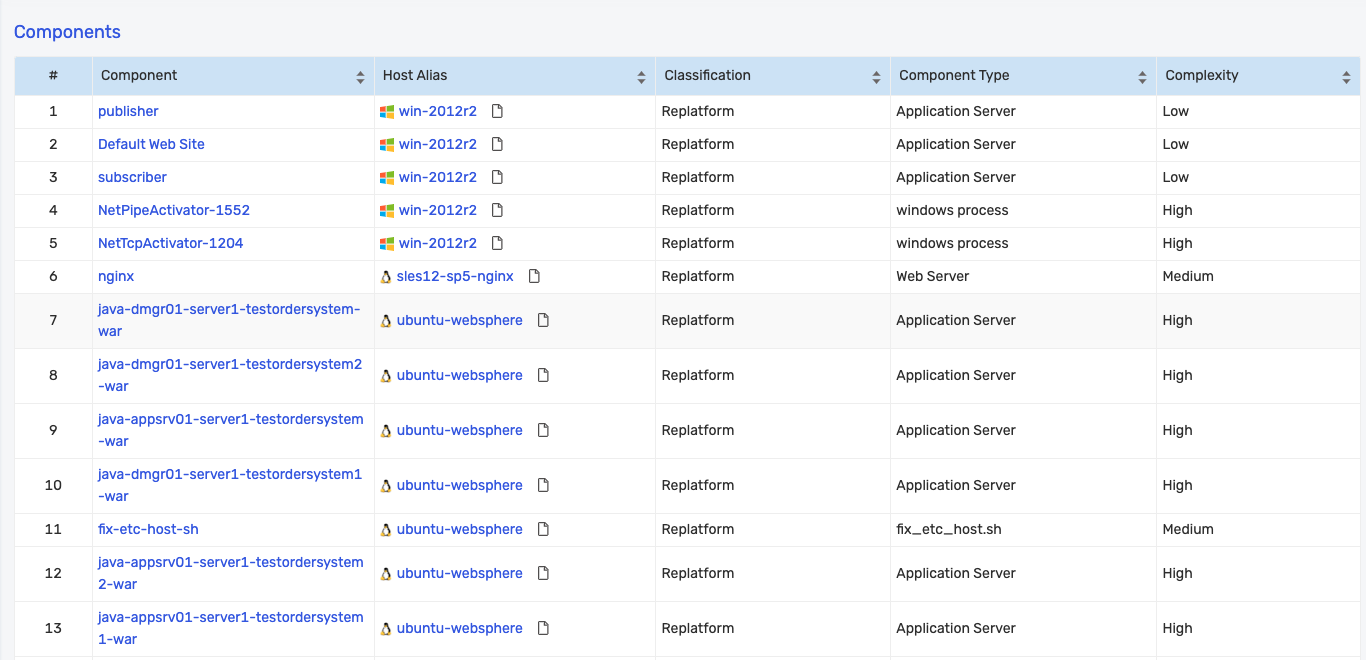
You can view the details of a component by clicking on the name of the component.
Clicking on the component opens the component details page:
You can click on the Rationalization Details page to get the rationalization information as shown below. You can edit the information by clicking the Edit button:
You can view the Practitioner Report for a host:
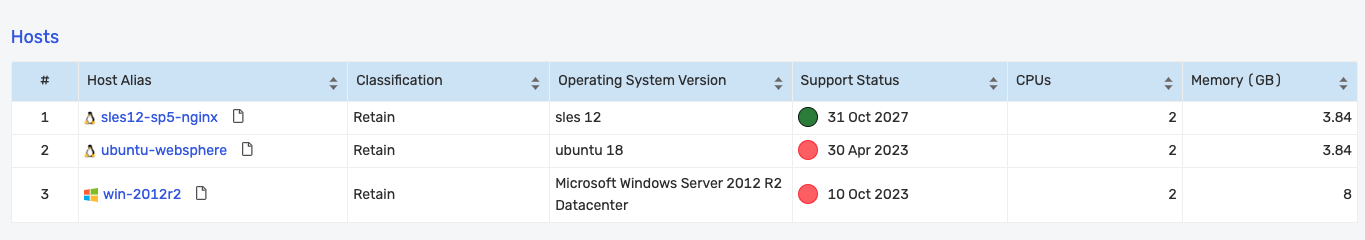
Hosts
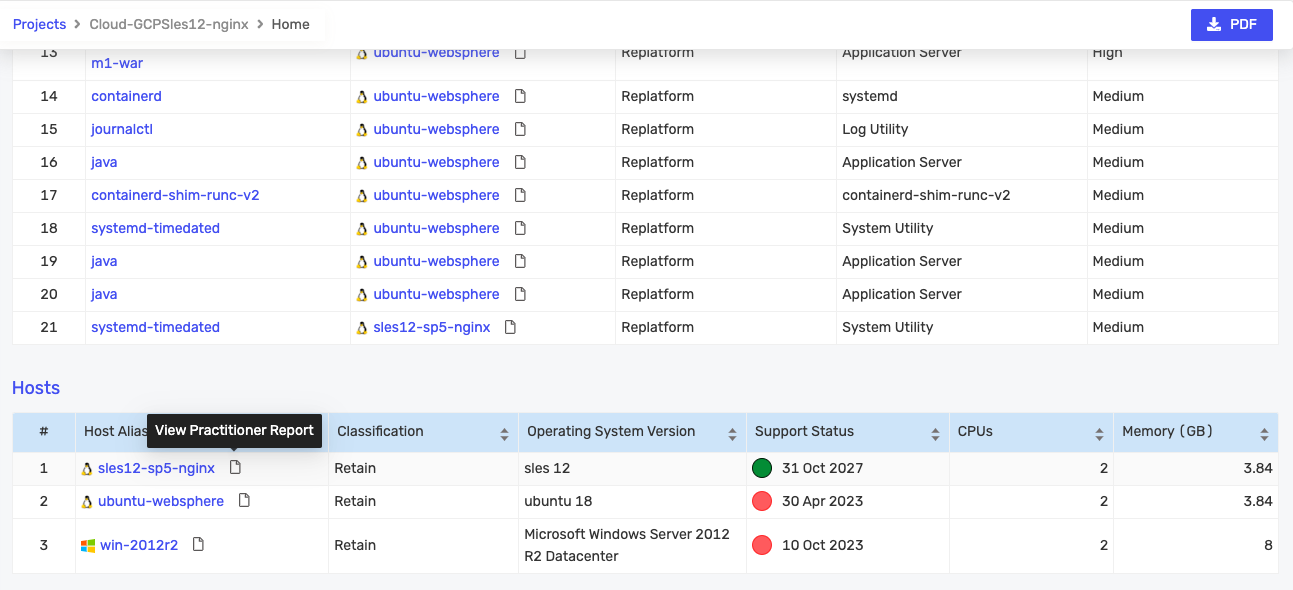
A table of the different hosts in the project with additional details is displayed as shown below:
You can view the details of a host by clicking on it.
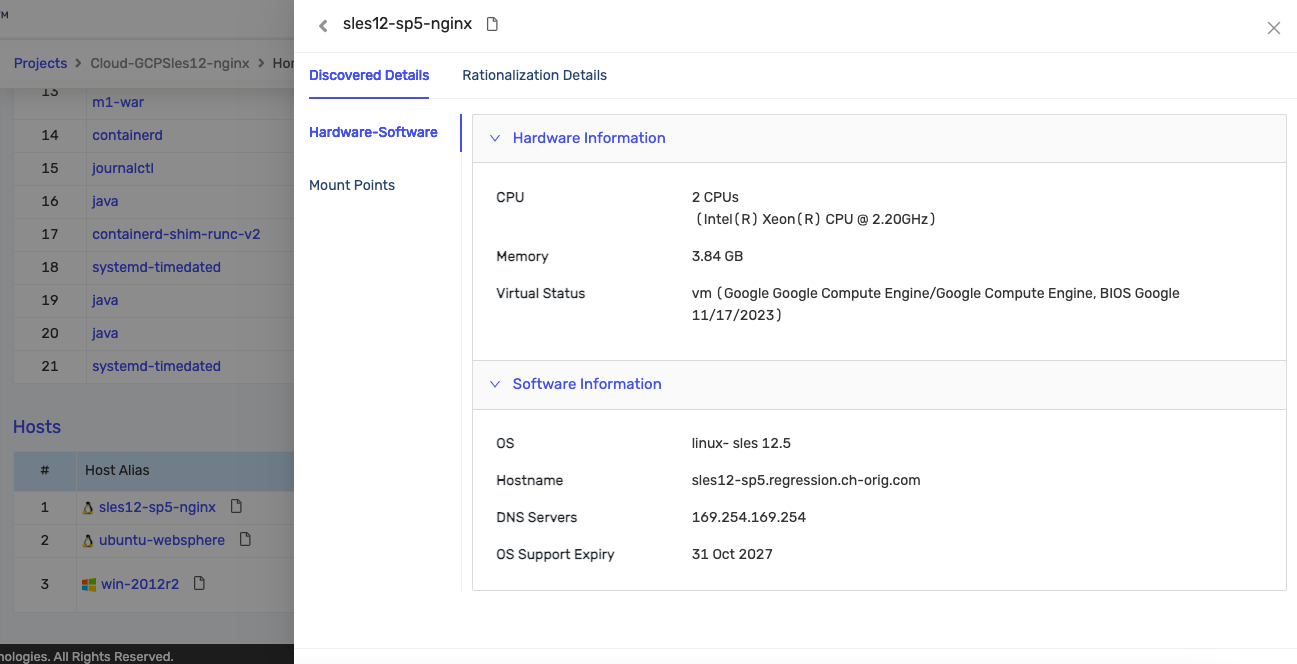
Clicking on it opens the host details page:
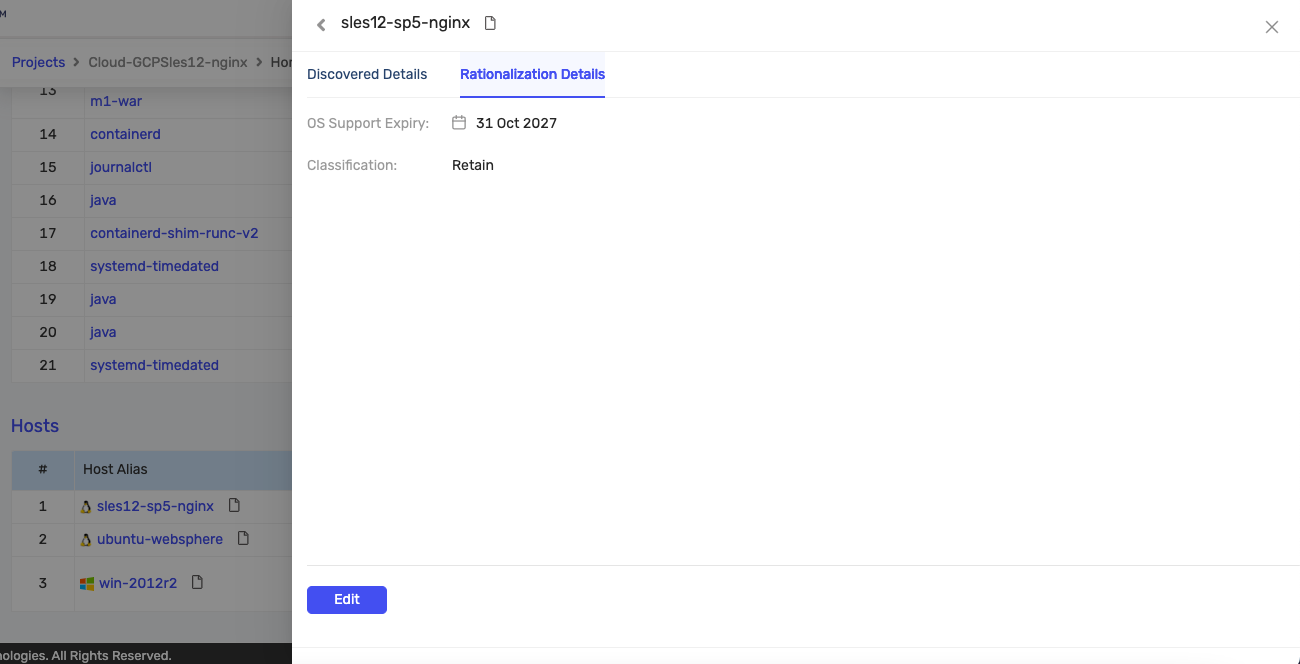
You can click on the Rationalization Details page to get the rationalization information as shown below. You can edit the information by clicking the Edit button:
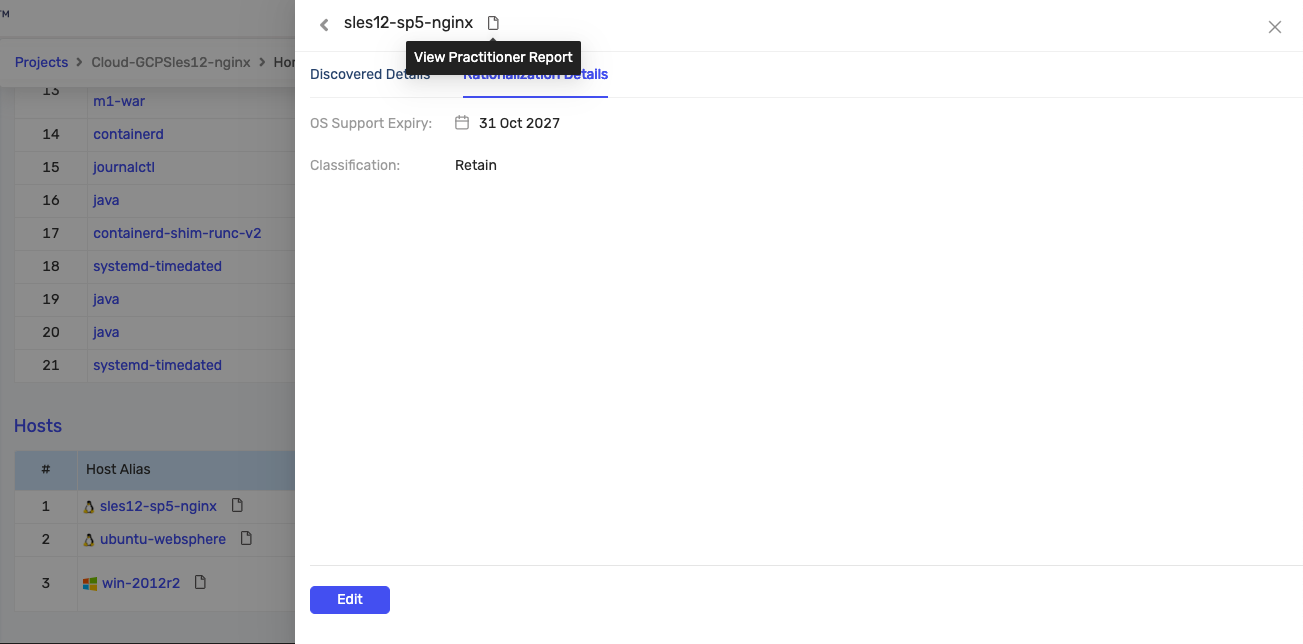
You can view the Practitioner Report for the host from this page as shown below:
You can view the Practitioner Report for a host from the DART report as shown below:
Download Report
You can click the PDF button to download a copy of the DART report as shown in the image below:

It will open the report in the print window as shown in the image below:
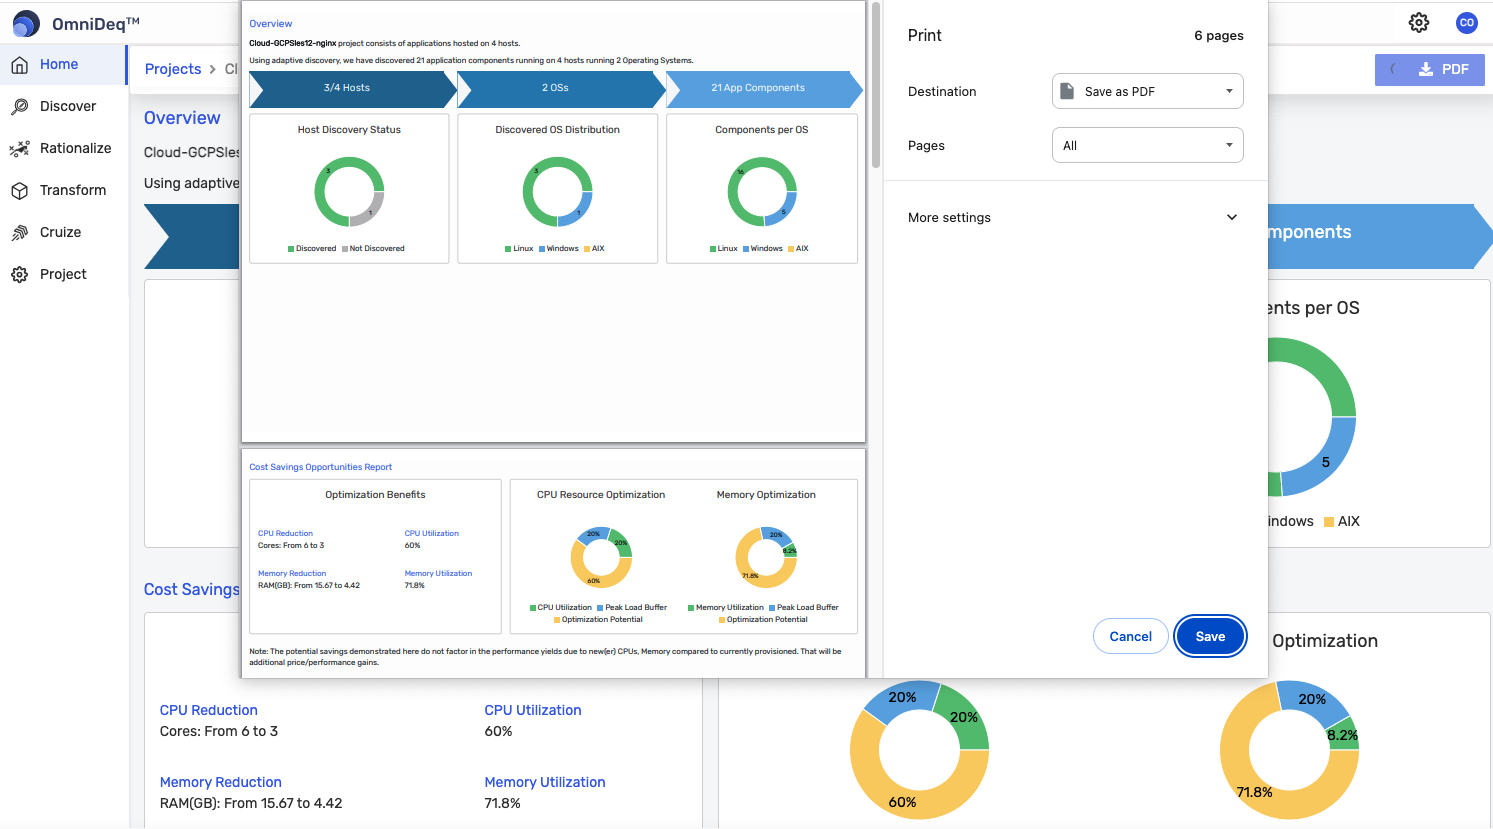
Click Save to download the PDF copy of the report.